MA documentation: Difference between revisions
Max Lehmann (talk | contribs) |
Max Lehmann (talk | contribs) |
||
| Line 132: | Line 132: | ||
{| | {| | ||
|- | |- | ||
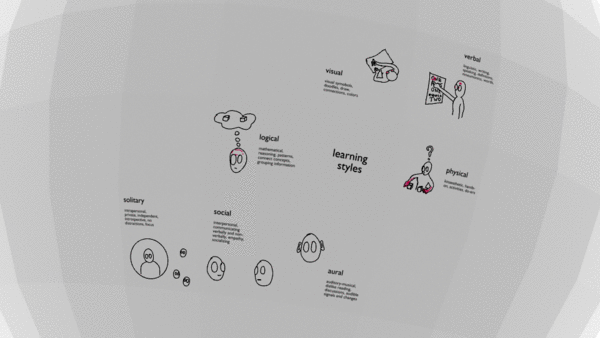
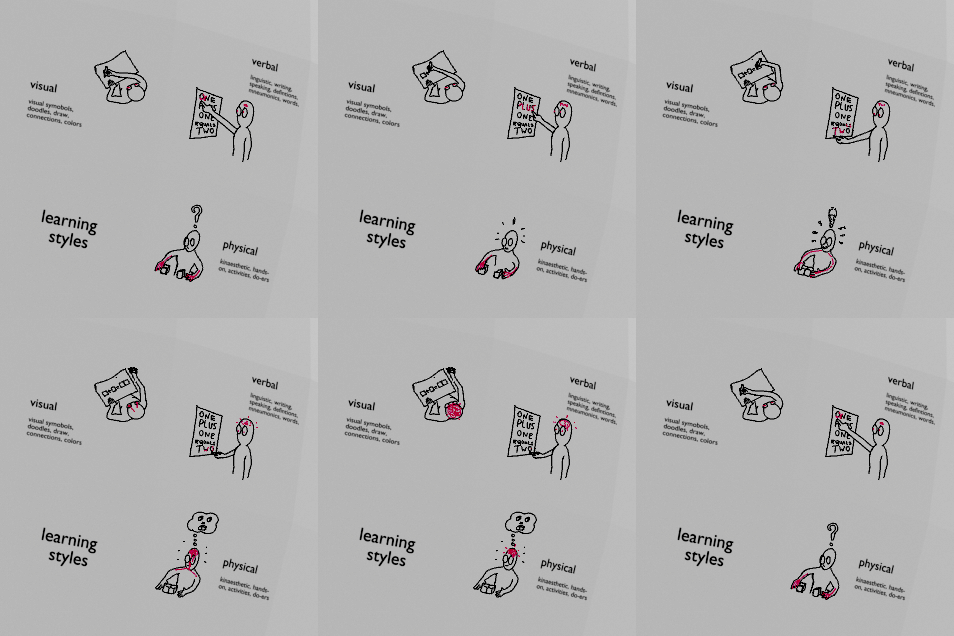
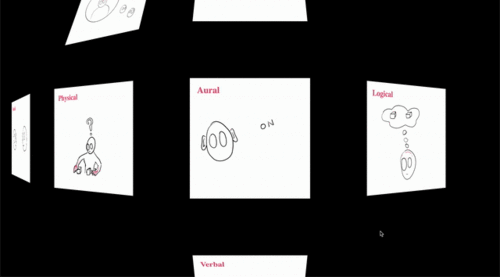
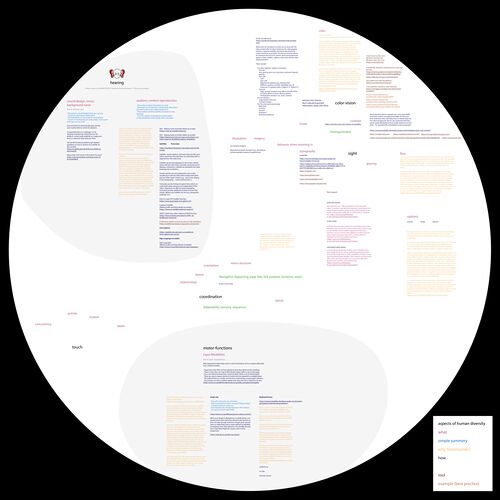
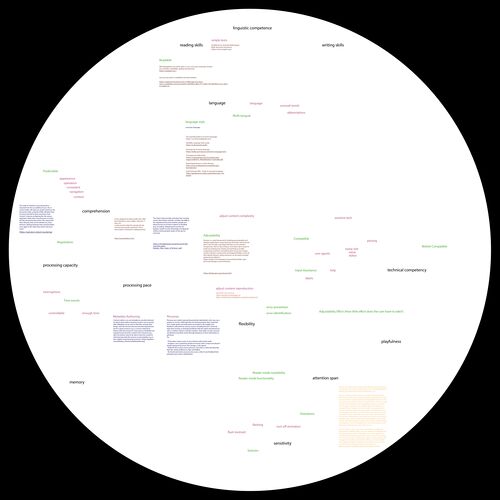
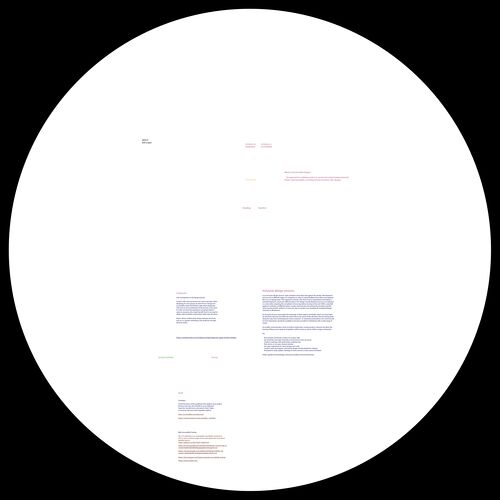
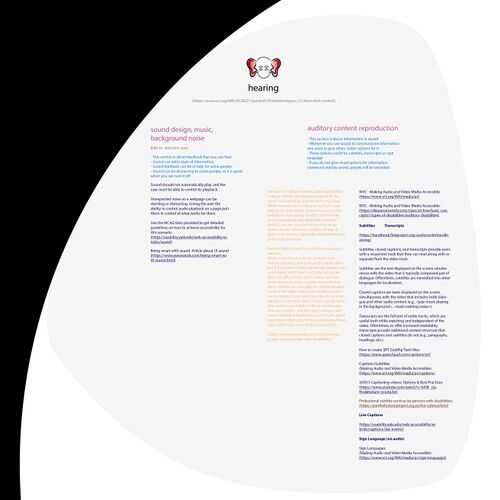
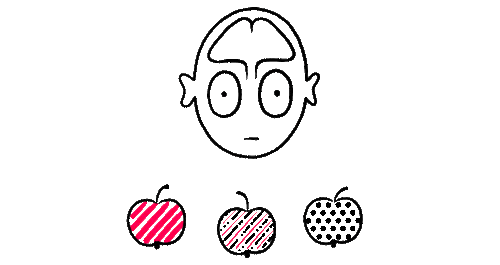
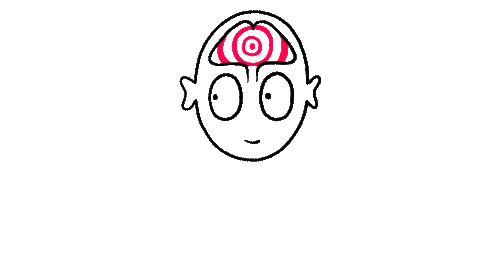
| [[File:DiversitySphere.gif|none|thumb|600px|Blender: Sphere with illustrations of learning styles arranged on it]] || [[File:Diversity_sphere_cropped.gif|none|thumb| | | [[File:DiversitySphere.gif|none|thumb|600px|Blender: Sphere with illustrations of learning styles arranged on it]] || [[File:Diversity_sphere_cropped.gif|none|thumb|500px|Blender: Sphere with illustrations of learning styles arranged on it]] | ||
|} | |} | ||
Revision as of 13:37, 18 June 2021
My Motivation
- My sister was born with Trisomy 21 (Down Syndrom).
- My parents raised her to be self-determined.
- For as long as I can remember my mother worked to support development towards a more inclusive society.
- I went to a primary school that was integrative. I had classes in a group that included children without and some with disabilities.
- I believe that everyone is valuable and should have equal opportunities.
- In my previous studies (Communication Design) I worked on the concept of inclusive factbooks. [See here] [and here]
- I am convinced that equal access to information and knowledge for all people is a basic prerequisite for a just society.
[Read more about my motivation in my thesis]
First Year
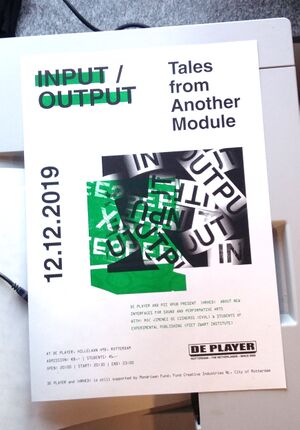
Special Issue X: Input Output
Special Issue X - Documentation
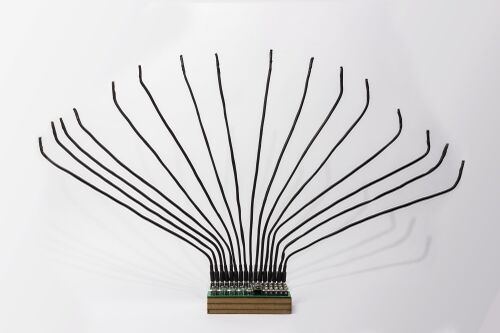
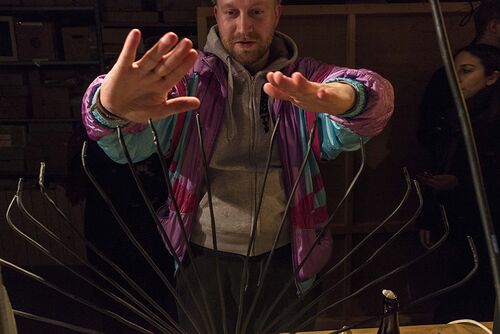
For [Special Issue X] I built GLARE, a 16 voice polyphonic synthesizer instrument that is based on Arduino. GLARE module is controlled by gestures only and thereby works in a very intuitive way. This project is based on the approach of simplifying complex processes in such a way that they can be used by a wide range of people with different abilities without much prior knowledge. The sensors can be easily removed from the unit for storage or transport.
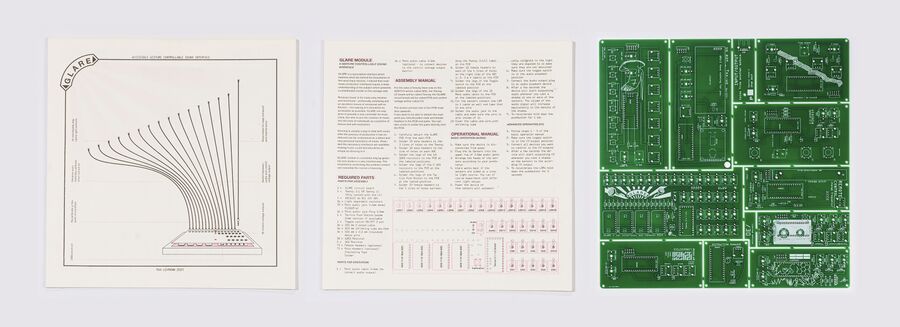
In this project, a group publication of 10 circuit boards was produced by the 10 students in vinyl record format. Together with 10 instructions for assembling the various modules, this publication is available from DePlayer in an original edition of 30. The project was also presented there.
[High resolution image of my publication contribution]
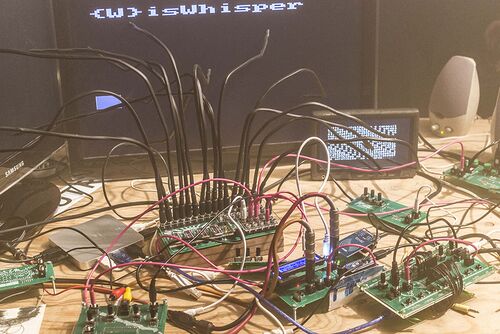
All modules could be connected with and reacted to each other.
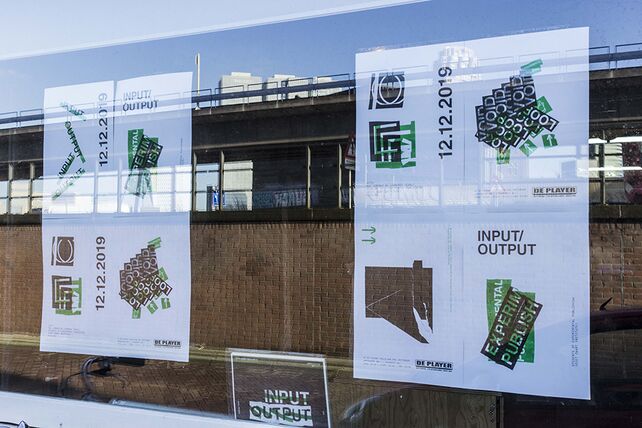
I was involved in the design of the visual identity of this exhibition.
Special Issue XI: We have secrets to tell you
My full Special Issue XI Documentation is not accessible to the public at this moment.
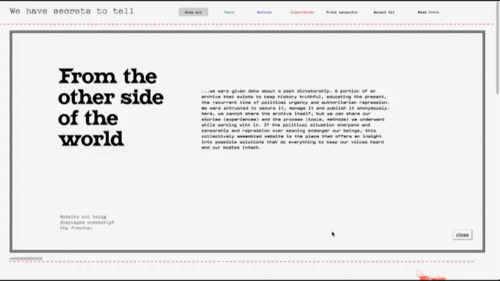
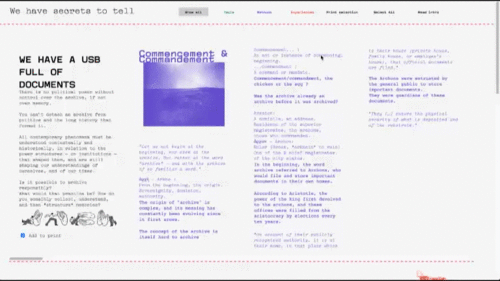
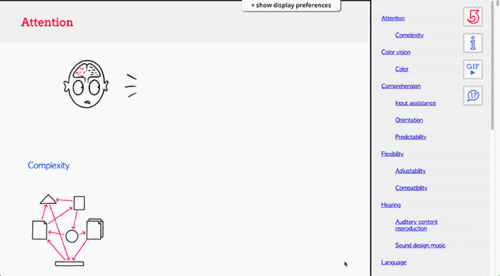
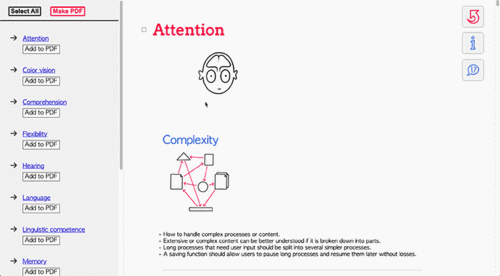
In [Special Issue XI] I came into first contact with (Semantic) MediaWiki queries. Later in the project, I was mainly involved in coding the publicly accessible part of our web publication. This was the first time for me to code in Javascript. On the website, it is possible to filter content and generate a print document from selected content.
In this project, my focus was on breaking down the collectively used processes into tools and methods. For each collected item I wrote short texts that explain what we used them for. I also developed an icon for each collected item.
Special Issue XII: Radio Implicancies
File:Max Lehmann Special Issue XII notebook.pdf
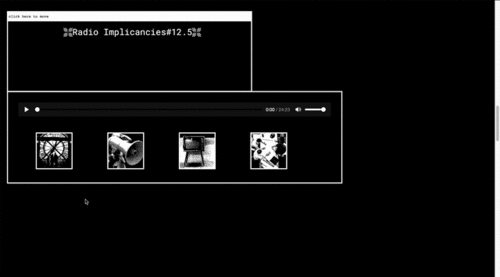
In [Special Issue XII] I mainly created audio content for our collective weekly broadcast. I was also involved in coding one of the web broadcasting interfaces.
Second Year
Proposal
Concept development
Initial thoughts
- Speculative experimental approach to inclusive interface design
- Simple language vs. Complex language - In which areas is it not possible to use simple language and why? Language as a barrier, as a weapon, as protection...
- What is normal? A publication about the developments of norms in societies. Predjudices, conformity... Technological norms and implications? (Queer Technologies) Reading Normal by Allen Frances. [Read more about this in my thesis.]
- Critical examination of the meaning of "normal" and problems that come with it. Is normal just an individual reflection of a perceived average of our surroundings? Normal is consistency in perception?
- Is there a definition of "normal", that is not exclusive towards minority groups? What will future norms be and how can they be changed?
- Interactive (game) website using 2D animation to explain what "normal" is normal and why
- Barrier-free calibration tool to make a website dynamically adjust to individual users
Inclusive web, user abilities and conditions
- Reduce barriers for web users - inclusive browser, (-plugin), website, wiki: Remove distraction, simplify, add illustration, layout...
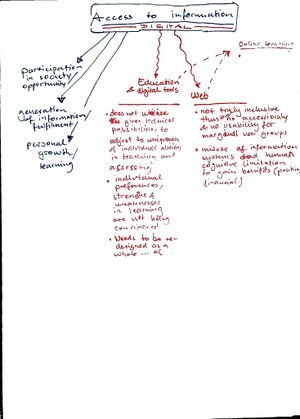
- Access to what kinds of information is crucial for equal participation? Who decides?
- How inclusive is the web with special regards to websites on which all kinds of "important information" is available.
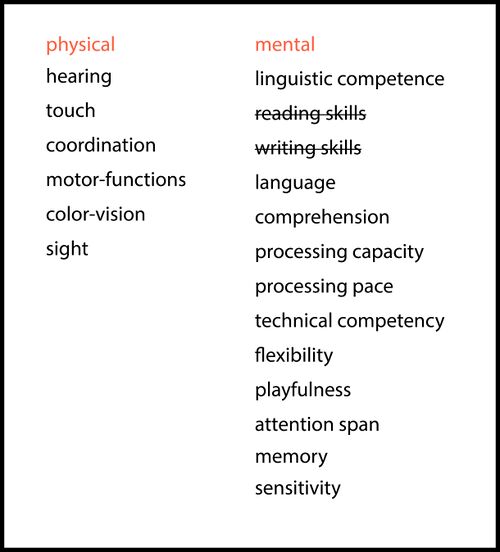
- Which user skills and conditions can affect equal access to information and knowledge?
Proposal (Summary)
For my master project, I am creating a website that allows for exploration of selected aspects of human diversity, due to which users or groups of users might be disadvantaged when information is presented to them, or they seek to access it.
This is to give an overview of possible necessary adaptations in the process of creating an inclusive publication in terms of design and content. It is also to inform about the human emotions that can be caused by facing a disadvantage in accessing information, maybe because of an individual special feature that has not been thought of in the creation process.
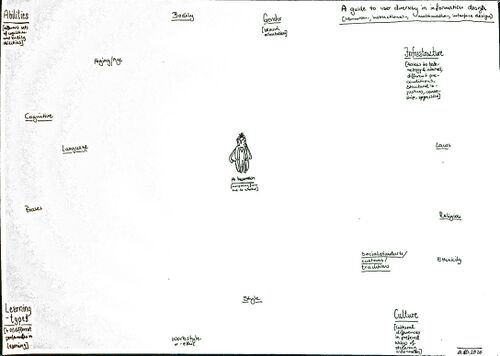
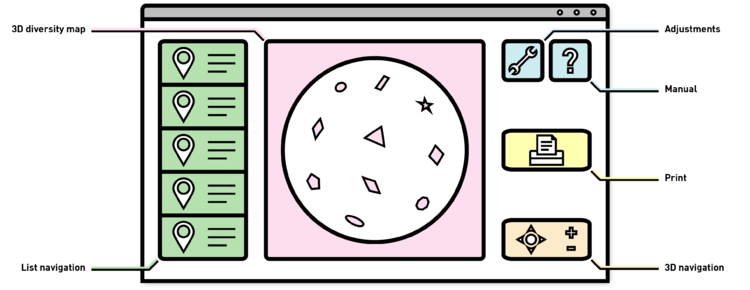
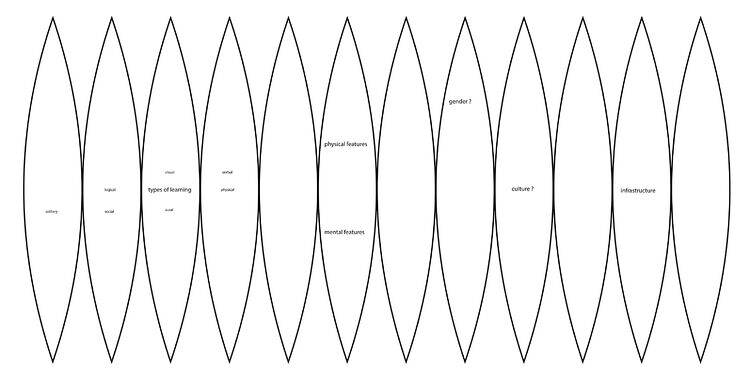
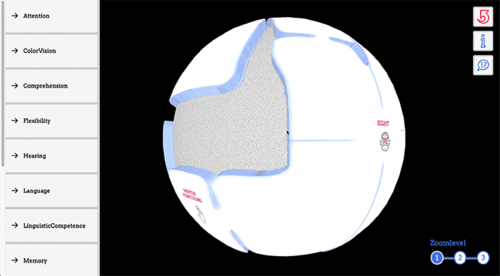
The website will consist of a spherical 3D map. On the 3D map selected aspects of human diversity will be arranged on the basis of their thematic proximity and interconnections. I will create animated illustrations to support the understanding of the information. Additionally, personal reports of various individuals will be provided, telling their experiences of exclusion. I chose the shape of the sphere, as its surface has no ends and no center.
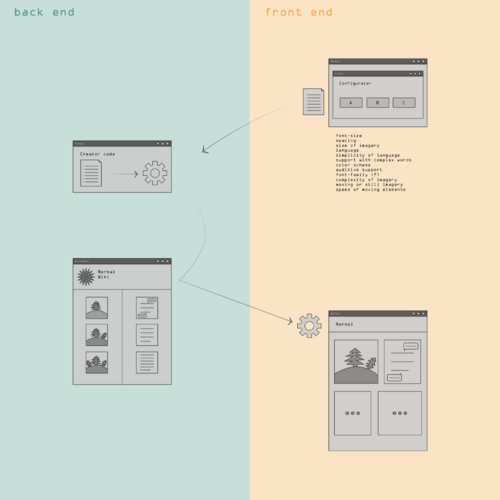
The interface of the website will allow for certain adjustments of the website‘s appearance according to user preferences, like font-size, color-scheme, speed of moving content, audio playback, or language. All texts will either be written in simple language, or each text will be available in different levels of complexity, from which the user can choose according to preference.
I will speak about the different aspects of human diversity exclusively in the form of individual symptoms and refrain from naming diagnoses.
Read my full Project proposal
Illustration
Prototyping
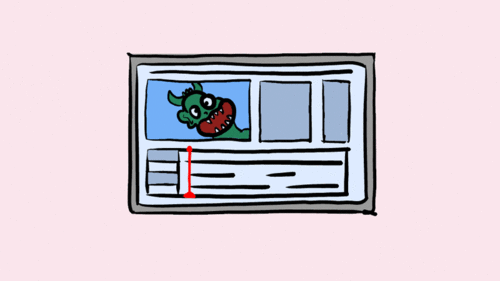
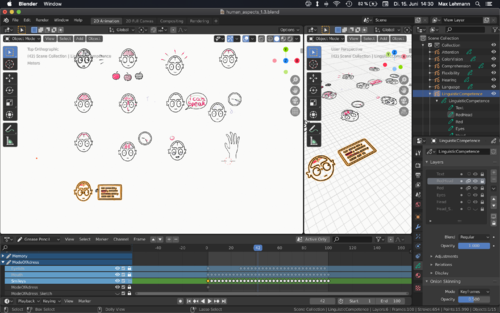
I used the open-source software [Blender] to create a prototype of the interface and to create 2D animated illustrations.
Over time I developed an understanding of various Javbascript libraries, especially [Three.js].
Over time I developed an interactive sphere interface on which information is arranged.
Check out my complete [Technical process index].
Workshop
Meet - Interface Together with Avital I developed a workshop in which we analyzed different websites according to criteria that would normally be used to examine people and social interactions. On the basis of this analysis, we played improvised theatre scenes and processed the insights gained as a group. Read the full [documentation page].
Resubmition
I was asked to resubmit my project proposal. The reasons for this were, as I understand it, that the scope of the proposed project was too large. I was advised to reduce the scope in order not to compromise the quality of my publication.
Accordingly, I narrowed the focus of the project. After analysing the possible channels of information communication, I decided to focus on the inclusive creation of websites. This was an obvious choice, as online research of necessary materials on this topic was particularly easy to implement. Also, the field of web design matched the development of my personal interests. Read more about this decision in my [Thesis]
With regard to the groups of aspects of human diversity, I decided to limit myself to disabilities because of my personal connection to this topic. Read more about this decision in my [Thesis]
New proposal
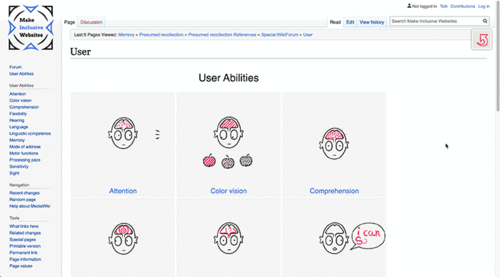
I will create an index of online references that can help with the creation of websites that work well for all people, including those with physical or mental disabilities. The references will be combined with individual testimonials of exclusion in this area, as well as illustrations and simple summaries. A wiki will serve as both, the primary interface to access these contents, as well as a backend from which I will conduct interface experiments. In these experiments, I will write scripts to create websites by querying contents from the wiki.
Read my full Resubmition.
Check out my [Resubmition Presentation].
Process
Concept / Contents
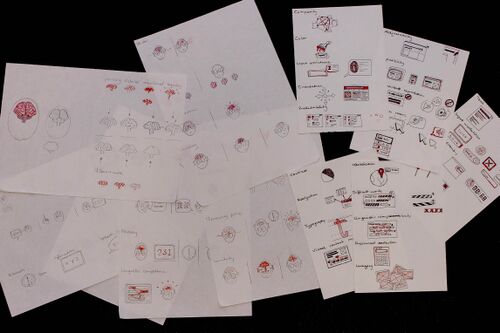
I gathered a collection of references and tools linked to the topic of the inclusive creation of websites. I used Adobe Illustrator to collect and organize the collected content in the beginning.
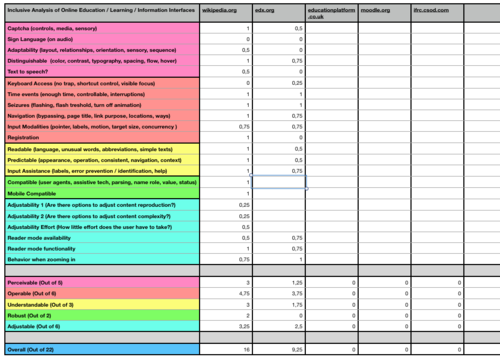
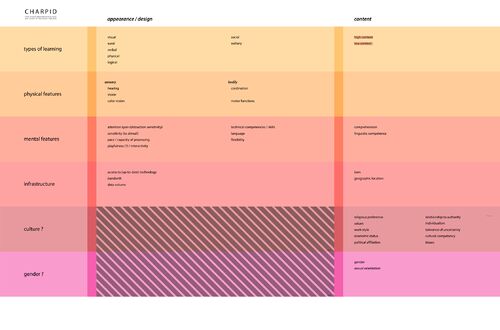
I settled on clear thematic areas and affiliations and connections of these. I rely on existing categorisations such as the Web Content Accessibility Guidelines, but sometimes expanded them with my own.
I did a lot of online research and created bookmarks with keywords for all the content that was relevant to my work. Later, I went through all the websites I had collected and embedded them in my structure.
I then listed these references in as uniform a scheme as possible (title, author, source for content and title, short description for tools) and revised them.
I wrote simple introductions to the different aspects of websites and revised them.
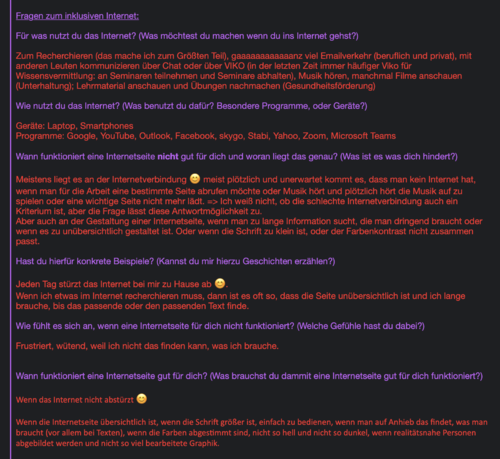
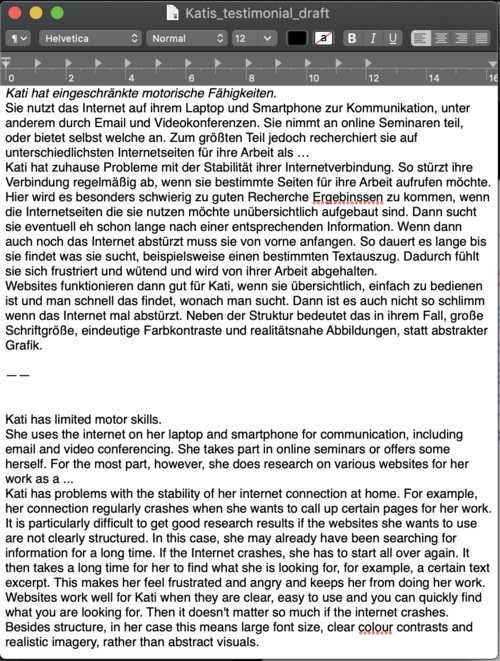
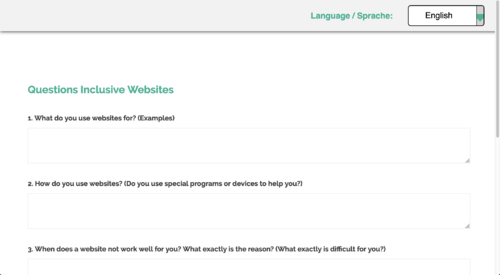
In order to collect the user stories as planned, I first developed a questionnaire in simple language which I made public via various distributors. The only response I received during the whole project was one from my personal contacts.
I made the questionnaire available as an [online survey] using the free [survey.js library].
I realized, that creating such stories in a respectful and authentic way takes time and direct collaboration with the individuals, which I was not able to do. So due to lack of time and other circumstances, I decided not to make any further efforts to collect these stories. I replaced the missing stories as much as possible with ones that I found online and that I partially shortened. Where I don't find any, I invite users to share their experiences through the online survey or in the [forum].
Wiki
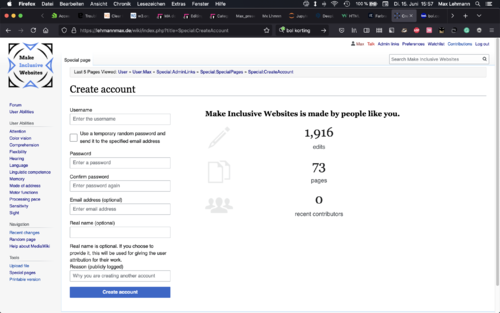
I structured the content on [my Wiki] using, among other extensions, [Pageforms] and [Cargo]. I set up and published my Wiki, as well as the rest of my publication, on a personal Raspberry Pi.
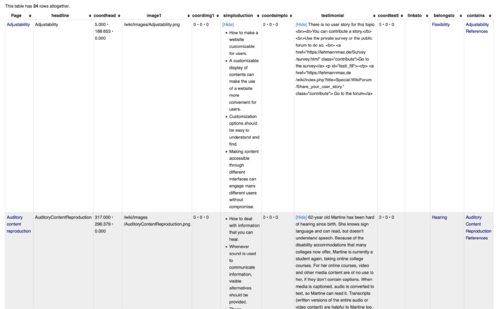
On my Wiki I implemented Templates and Forms with Page-Forms and stored the information in Cargo tables.
{{References
|headline1=General
|coordhead1=10.000, 285.000, 0.000
|references1=
Use headings to convey meaning and structure;
Tips for Getting Started - 3WC Web Accessibility Initiative;
https://www.w3.org/WAI/tips/writing/#use-headings-to-convey-meaning-and-structure;
Section Headings;
Understanding Web Content Accessibility Guidelines (WCAG) 2.1;
https://www.w3.org/WAI/WCAG21/Understanding/section-headings;
Headings and labels;
Understanding Web Content Accessibility Guidelines (WCAG) 2.1;
https://www.w3.org/WAI/WCAG21/Understanding/headings-and-labels.html
|headline2=Dividing Processes
|coordhead2=16.000, 285.000, 0.000
|references2=
Multi-page Forms;
Web Accessibility Tutorials - 3WC Web Accessibility Initiative;
https://www.w3.org/WAI/tutorials/forms/multi-page/;
Progress Trackers in UX Design;
Nick Babich;
https://uxplanet.org/progress-trackers-in-ux-design-4319cef1c600;
Multi-step form design: Progress indicators and field labels;
Kristen Willis;
https://www.breadcrumbdigital.com.au/multi-step-form-design-part-1-progress-indicators-and-field-labels/
|linksto=
|belongsto=Complexity
|contains=
}}
Technical process
General
The information in all the interfaces is retrieved from my Wiki as a cargo query with Javascript "fetch" in JSON format.
let fetchhuman = (promise) => {
   return fetch("/wiki/index.php?title=Special:CargoExport&tables=human%2C&&fields=human._pageName%2C+human.headline%2C+human.coordinates%2C+human.image1%2C&&order+by=%60cargo__human%60.%60_pageName%60%2C%60cargo__human%60.%60headline%60%2C%60cargo__human%60.%60coordinates__full%60+%2C%60cargo__human%60.%60image1%60&origin=*&limit=100&format=json").then(r=>r.json()).then(data=>{
...
Then all the contents of the query data are rendered into HTML elements.
for (let i = 0; i < data.length; i++) {
    var content = data[i];

    var div = document.createElement("div");
    div.setAttribute("id", content._pageName);
    document.body.appendChild(div);

    var image = document.createElement("img");
    image1.setAttribute("src", content.image1);
    image1.setAttribute("alt", "Illustration of " + content.headline);
    div.append(image1);

    var head = document.createElement("h2");
    temphead.innerHTML = content._pageName;
    temphead.setAttribute("id", content.headline+"head");
    div.appendChild(temphead);

    ...
Some parts of the data, like the references need to be sorted.
let references = content.references1;
references.unshift("Empty");

let ref_link = references1.filter(function(value, index, Arr) {
    return index % 3 == 0;
});
ref_link.shift();

let ref_head = references.filter(function(value, index, Arr) {
    return index % 3 == 1;
});

let ref3desc = references3.filter(function(value, index, Arr) {
    return index % 3 == 2;
});

for (let i = 0; i < ref3head.length; i++) {
    if (ref3head[i]!== ""){
        var ref3headline = ref3head[i];
        var ref3description = ref3desc[i];
        var ref3link = ref3lin[i];
        ...
I used the "belongsto" information in my Cargo tables to assign the subtopics to the corresponding parent topics.
var belongsto = content.belongsto[0];
var parent = document.getElementById(belongsto);

...

parent.appendChild(div);
On this basis, the information is then processed according to the requirements of the different interfaces. Also other elements, like the sidebar navigation are created from the query data
//First query
var sidebar = document.getElementById("ulist");

var li = document.createElement("li");
sidebar.appendChild(li);

var listelem = document.createElement("A");
listelem.innerHTML = content._pageName;
listelem.setAttribute("href", "#"+content._pageName);
listelem.setAttribute("id", content._pageName+"_listelem");
li.appendChild(listelem);

var sublist = document.createElement("ul");
sublist.setAttribute("id", content._pageName+"_sublist");
li.appendChild(sublist);

//Second query
var listparent = document.getElementById(content.belongsto[0]+"_sublist");
var li = document.createElement("li");
listparent.appendChild(li);

var listelem = document.createElement("A");
listelem.innerHTML = content._pageName;
listelem.setAttribute("href", "#"+content._pageName);
listelem.setAttribute("id", content._pageName+"_listelem");
li.appendChild(listelem);
On all my interfaces, I have paid special attention to keyboard navigation.
For some interfaces, I wrote a function that allows navigation of the sidebar with the arrow keys.
var canvasKBcontrol = true;
$(document).keyup(function(e){
    if ($(":focus").hasClass( "sidebar" )||$(":focus").hasClass( "sidebar_master" )) {
        canvasKBcontrol = false;
    } else {
        canvasKBcontrol = true;
    };

    if (e.keyCode == 40 && canvasKBcontrol == false) {
        var next0 = $(".listelem.sidebar.focused").next().find('a.listelem.sidebar').first();
        var next1 = $(".listelem.sidebar.focused").parent().next().find('a.listelem.sidebar').first();
        var next2 = $(".listelem.sidebar.focused").parent().parent().parent().next().find('a.listelem.sidebar').first();

        if (next0.length == 1 && canvasKBcontrol == false) {
            $(".sidebar.focused").next().find('.sidebar').first().focus();
        } else if (next0.length == 0 && next1.length != 0 && canvasKBcontrol == false){
            $(".listelem.sidebar.focused").parent().next().find('a.listelem.sidebar').first().focus();
        } else if (next0.length == 0 && next1.length == 0 && canvasKBcontrol == false){
            $(".listelem.sidebar.focused").parent().parent().parent().next().find('a.listelem.sidebar').first().focus();
        };

        $(".sidebar.focused").removeClass("focused");
        $(".sidebar:focus").addClass("focused");
        $(".sidebar:focus").on("click", function() {
        $(this).id.replace('_listelem', '').prepend('.').append('head').focus;
        });
    };

    if (e.keyCode == 38 && canvasKBcontrol == false) {
        var next0 = $(".sidebar.focused").parent().parent().prev();
        var next1 = $(".listelem.sidebar.focused").parent().prev().find('a.listelem.sidebar').last();
        var next2 = $(".listelem.sidebar.focused").parent().parent().parent().prev().find('a.listelem.sidebar').last();
        console.log("next0 ", next0)
        console.log("next1 ", next1);
        console.log("next2 ", next2);
        if (next1.length == 0 && next0.length == 1 && canvasKBcontrol == false) {
            $(".sidebar.focused").parent().parent().prev().focus();
        } else if (next1.length != 0 && canvasKBcontrol == false){
            $(".listelem.sidebar.focused").parent().prev().find('a.listelem.sidebar').last().focus();
        } else if (next0.length == 0 && next1.length == 0 && canvasKBcontrol == false){
            $(".listelem.sidebar.focused").parent().parent().parent().prev().find('a.listelem.sidebar').last().focus();
        };

        $(".sidebar.focused").removeClass("focused");
        $(".sidebar:focus").addClass("focused");
        $(".sidebar:focus").on("click", function() {
        $(this).id.replace('_listelem', '').prepend('.').append('head').focus;
        });
    };

    if (canvasKBcontrol == false) {
        $(".listelem.sidebar").css("background", "#efefef");
        $(".listelem.sidebar.focused").css("background", "#cecece");
    } else {
        $(".listelem.sidebar").css("background", "#efefef");
    };
});

$(document).keydown(function(e){
    if (e.keyCode == 40 && canvasKBcontrol == false) {
        e.preventDefault();
        $('.focused').focus();
     };

    if (e.keyCode == 38 && canvasKBcontrol == false) {
        e.preventDefault();
        $('.focused').focus();
     };
});

let setfocus = (promise) => {
    $('#Attention_listelem').addClass("focused");
};
To ensure the correct loading of all contents in the appropriate order, I have chained the "fetch" functions with so-called promises (".then").
fetchhuman().then(fetchwebsite).then(fetchreferences).then(function(){
    makesidebar();
    removetabindex();
    loadtoposphere();
    doneloading();
});
Globe
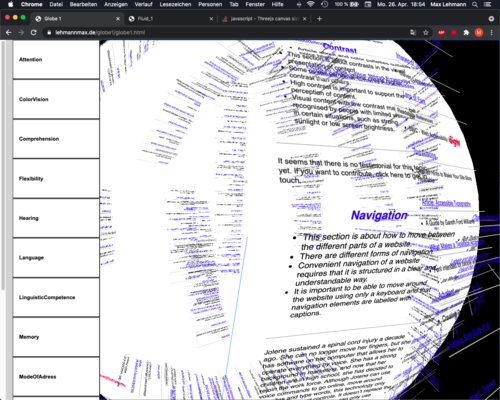
The interface I have spent the most time on is the "Globe" interface.
Throughout the process, I have steadily increased my understanding of the Threejs library and gradually created my own interface that has typical card functions and controls. During the process, I also looked for and tried other approaches. In particular, I looked for free, highly customisable Javascript-based environments that already provided map functionality. However, in the end, none of the tried possibilities could fulfil all my requirements.
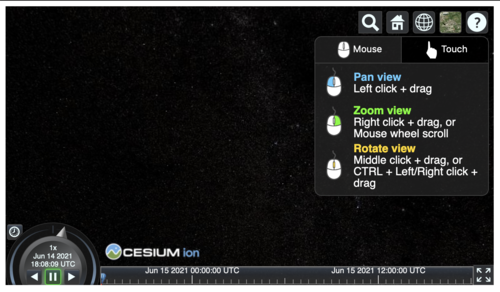
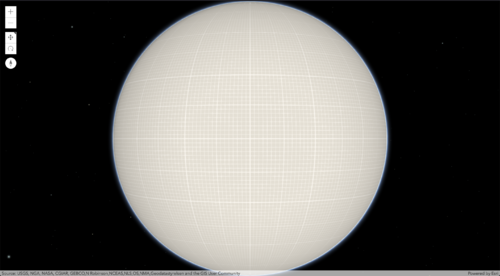
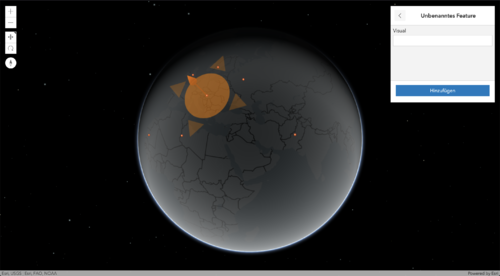
I tried [Leaflet], [ArcGIS], [Cesium] and others.
As a consequence, I created several of these functionalities myself.
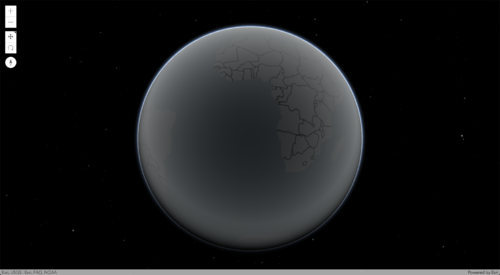
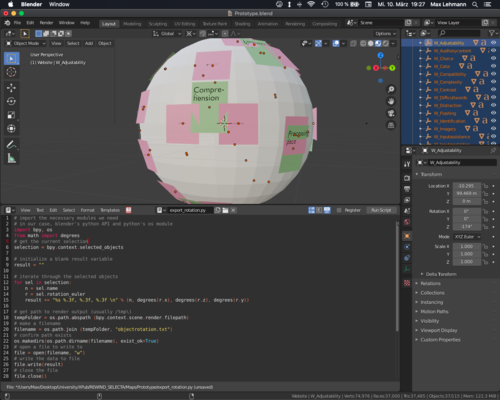
The setup for the basic scene consists of a spherical 3D object (mesh), to which CSS3D Elements are appended. On top of the spherical 3D Object, which is then turned transparent, a GLB model gets loaded. The coordinates for how to position the objects are stored in the Cargo tables. To find the right coordinates in the beginning I recreated the globe in Blender, positioned them there and then exported a list of all coordinates through Blender's Python console.
In ThreeJS all CSS3DElements get positioned using the radius of the globe, a pivot point in the middle of the globe and the coordinates.
var div = document.createElement("div");

var obj = new CSS3DObject(div);
globe.add(obj);

var pivot = new THREE.Group();
obj.add(pivot);
pivot.add(obj);
scene.add(pivot);
pivot.position.set(0, 0, 0);
pivot.rotation.set(0, 0, 0);
obj.position.set(0, 0, radius);

rotateObject(pivot,content.coordinates[0],content.coordinates[1],content.coordinates[2]);
For rotating in a 3D environment it is important to rotate the individual axis in the right order. I use a special function to rotate elements.
function rotateObject(object, degreeX=0, degreeY=0, degreeZ=0) {
    object.rotateZ(THREE.Math.degToRad(degreeZ));
    object.rotateY(THREE.Math.degToRad(degreeY));
    object.rotateX(THREE.Math.degToRad(degreeX));
};
However, I did not want to work with more than one set of coordinates per cargo table entry, as this would not have been feasible given the amount of data. Therefore, the positions of most objects are calculated in functions and then placed.
//Placing blocks of text (in this case 'User Stories') with the right distance to another by counting the amount of letters in the texts.
var positioncalc2 = content.testimonial.length/100;
var contcoordhead0_1 = contcoordhead0+positioncalc*1.1+positioncalc2*0.6;
if (contcoordhead0_1 >= 360) {contcoordhead0_1-=360;};
rotateObject(pivot3,contcoordhead0_1,content.coordhead[1],content.coordhead[2]);


//Placing the references in a grid and adjusting the spacing towards the poles
var vertical_spacer = 6;
var horizontal_spacer = 6;

if (count1 == 0 || count1 == 1 || count1 == 2) {
    count1 += 1;
} else if (count1 == 3){
    count1 = 1;
    count2 += 1;
};

var div = document.createElement("div");

var obj = new CSS3DObject(div);
globe.add(obj);

var pivot = new THREE.Group();
obj.add(pivot);
pivot.add(obj);
scene.add(pivot);
pivot.position.set(0, 0, 0);
pivot.rotation.set(0, 0, 0);
obj.position.set(0, 0, radius);
var vertical_rotation = content.coordhead1[0]+vertical_spacer*count2;


if (inRange(vertical_rotation, 228, 263)){
    horizontal_spacer = 12;
} else if (inRange(vertical_rotation, 263, 278)){
    horizontal_spacer = 11;
} else if (inRange(vertical_rotation, 278, 293)){
    horizontal_spacer = 10;
} else if (inRange(vertical_rotation, 293, 308)){
    horizontal_spacer = 9;
} else if (inRange(vertical_rotation, 308, 323)){
    horizontal_spacer = 8;
}

else if (inRange(vertical_rotation, 103, 130)){
    horizontal_spacer = 12;
} else if (inRange(vertical_rotation, 88, 103)) {
    horizontal_spacer = 11;
} else if (inRange(vertical_rotation, 63, 88)){
    horizontal_spacer = 10;
} else if (inRange(vertical_rotation, 48, 63)){
    horizontal_spacer = 9;
} else if (inRange(vertical_rotation, 38, 48)){
    horizontal_spacer = 8;
} else {};

if (count1 == 1) {
    horizontal_spacer=6;
}
if (count1 == 2) {
    horizontal_spacer-=(horizontal_spacer-6)/3;
}

var horizontal_rotation = content.coordhead1[1]+horizontal_spacer*count1;
if (horizontal_rotation > 360){
    horizontal_rotation -= 360;
} else {}

if (vertical_rotation > 360){
    vertical_rotation -= 360;
} else {}

rotateObject(pivot,vertical_rotation,horizontal_rotation,content.coordhead1[2]);
The CSS3D Elements are rendered in a different way than the globe and GLB model. As a result, the globe doesn't obscure the CSS3D Elements on the back of it as you would expect it to.
This is why I had to write a clipping function to disable the display of content, that is not facing the viewer. I did so by comparing the coordinates of the Objects to the orientation of the cameras pivot point. I had to convert and clean up the numbers multiple times to do this. The "seam" of the globe where the values jump from 360 to 0 degrees was particularly challenging.
function inRange(x, min, max) {
    return ((x-min)*(x-max) <= 0);
};

function clipping() {
    var newY = camera.rotation.y;
    var newX = camera.rotation.x;

    var Ydegrees = THREE.Math.radToDeg( newY );
    var Xdegrees = THREE.Math.radToDeg( newX );
    if (Ydegrees < 0) {
        var Ydgr = Ydegrees + 360;
    } else {
        var Ydgr = Ydegrees;
    };

    if (Xdegrees < 0) {
        var Xdgr = Xdegrees + 360;
    } else {
        var Xdgr = Xdegrees;
    };

    for (let i = 0; i < alldivs.length; i++ ) {
        var content = alldivs[i];
        var Ycoord = allcoordinatesY[i];
        var Xcoord = allcoordinatesX[i];
        var YLlim = Ydgr+40;
        var YRlim = Ydgr-40;
        var XLlim = Xdgr+40;
        var XRlim = Xdgr-40;

        if (inRange(Ycoord,0,60)) {
            if (inRange(Ydgr,0,180)) {
            } else {
                Ycoord += 360;
            };
        } else if (inRange(Ycoord,300,360)) {
            if (inRange(Ydgr,0,180)) {
                Ycoord -= 360;
            } else{
            };
        };

        if (inRange(Xcoord,0,60)) {
            if (inRange(Xdgr,0,180)) {
            } else {
                Xcoord += 360;
            };
        } else if (inRange(Xcoord,300,360)) {
            if (inRange(Xdgr,0,180)) {
                Xcoord -= 360;
            } else{
            };
        };

        if (inRange(Ycoord,YLlim,YRlim)&&inRange(Xcoord,XLlim,XRlim)){
            content.style.display = "";
        } else {
            content.style.display = "none"
        };

        if (inRange(Xdgr,270,300) && inRange(Xcoord,270,300)) {
            content.style.display = "";
        } else if (inRange(Xdgr,90,60) && inRange(Xcoord,90,60)){
            content.style.display = "";
        } else {};

    };
};
What I found particularly exciting about the medium of the interactive map is how it is possible to switch between different levels of complexity through simple and intuitive user input. I wanted to use this to switch between different levels of information by zooming in and out. Therefore I wrote a function that hides and shows levels of content depending on the zoom level.
function mapzoom()  {
   var ZL;
   if (zoom > zoomtreshold1) {
      ZL = 1;
      zoombuttonone.classList.add("active");
      zoombuttontwo.classList.remove("active");
      zoombuttonthree.classList.remove("active");
      rotintervall = 0.1;
   } else if (zoom > zoomtreshold2){
      ZL = 2;
      zoombuttonone.classList.remove("active");
      zoombuttontwo.classList.add("active");
      zoombuttonthree.classList.remove("active");
      rotintervall = 0.07;
   } else {
      ZL = 3;
      zoombuttonone.classList.remove("active");
      zoombuttontwo.classList.remove("active");
      zoombuttonthree.classList.add("active");
      rotintervall = 0.02;
   }

   if (zoomLevel != ZL) {
      zoomLevel = ZL;
      const mapelem1 = document.querySelectorAll(".head1, .image1, .paragraph1, .link1, .human");
      const mapelem2 = document.querySelectorAll(".head2, .image2, .paragraph2, .link2, .website");
      const mapelem3 = document.querySelectorAll(".head3, .image3, .paragraph3, .link3, .references");
      const headelem1 = document.querySelectorAll("h1");
      const imgelem1 = document.querySelectorAll(".image1");

      if (zoomLevel == 1) {controls.rotateSpeed = 0.6;}
      else if (zoomLevel == 2) {controls.rotateSpeed = 0.3;}
      else {controls.rotateSpeed = 0.1;}

      for (var i = 0; i < mapelem1.length; i++) {
         if (zoomLevel == 1) {
            mapelem1[i].style.display = "";
         } else if (zoomLevel == 2) {
            mapelem1[i].style.display = "none";
         } else {
            mapelem1[i].style.display = "none";
         }
      }
...
I have implemented additional keyboard commands for the globe in order to make it easier to use with the keyboard.
function zoomforme(thisfar) {
    var zoomDistance = thisfar;
    var factor = zoomDistance/zoom;
    camera.position.x *= factor;
    camera.position.y *= factor;
    camera.position.z *= factor;
}

//Arrowkeys
var UPpressed = false;
var DOWNpressed = false;
var rotintervall = 0.1;
var canvasKBcontrol = true;
document.onkeydown = function(e) {
    if (canvasKBcontrol) {
        switch (e.keyCode) {
          case 38:
            controls.rotCamPolarUp(rotintervall);
          break;
          case 40:
            controls.rotCamPolarDown(rotintervall);
          break;
          case 37:
            controls.rotCamAzimuthalLeft(rotintervall);
          break;
          case 39:
            controls.rotCamAzimuthalRight(rotintervall);
          break;
        }
    };

        switch (e.keyCode) {
          case 49:
                zoomforme(radius + radius/10*5.5);

          break;
          case 50:
                zoomforme(zoomtreshold1-300);

          break;
          case 51:
                zoomforme(zoomtreshold2-100);
          break;
    };
};
In order to implement all the functions accordingly, I had to modify the control system OrbisControls included in ThreeJS. Among other things, I have made public methods that were not available before in order to be able to use them.
this.setPolarAngle = function (angle) {
  phi = angle;
  this.forceUpdate();
};

this.setAzimuthalAngle = function (angle) {
  theta = angle;
  this.forceUpdate();
};

this.zoomIn = function (level) {
    dollyIn(level);
    this.update();
    //console.log("hi from the other script");
};

this.zoomOut = function (level) {
    dollyOut(level);
    this.update();
    //console.log("hi from the other script");
};

this.rotCamPolarUp = function (rotintervall) {
    phi -= rotintervall;
    this.forceUpdate();
};

this.rotCamPolarDown = function (rotintervall) {
    phi += rotintervall;
    this.forceUpdate();
};

this.rotCamAzimuthalLeft = function (rotintervall) {
    theta -= rotintervall;
    this.forceUpdate();
};

this.rotCamAzimuthalRight = function (rotintervall) {
    theta += rotintervall;
    this.forceUpdate();
};
To create the GLB model with topography and texture I went through the following steps:
- Replace all CSS3DElements in my ThreeJS scene with sphere 3DObjects (meshes), because as far as I know you cannot export CSS3DElements and open them in other environments. Colour code these objects according to thematic belonging.
- Write a function to export the globe with the attached objects.
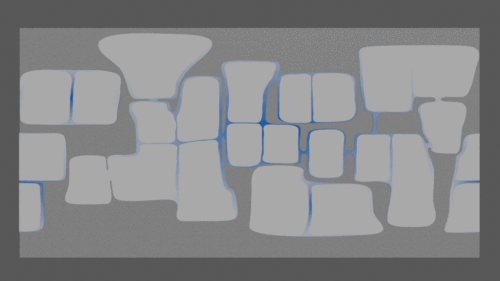
- Open the exported PLY model in blender and overlay it on a sphere with a 2-dimensional texture to see which contents are in which places. Paint the shape of the different content groups onto the texture.
- Check the resulting 2-dimensional texture (JPG file) in my ThreeJS scene and adjust it if necessary.
- Clean up the texture (JPG file) in Illustrator and convert it to vectors.
- Import the vectors (SVG file) into a new Blender document, convert into a mesh, correct the distribution of faces and solidify.
- Create a new mesh plane, apply the texture (JPG file) to it and punch out with the created mesh using Blender Booleans.
- Solidify the punched out areas in the mesh layer.
- Bind the whole mesh plane with Blender Surface Deform to another, new mesh plane.
- Modify the new mesh plane with Blender Simple Deform (Bend) to a sphere.
- Export as GLB model, load into the ThreeJS scene, place and scale.
Illustration
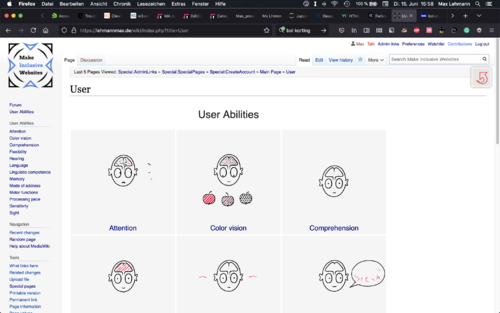
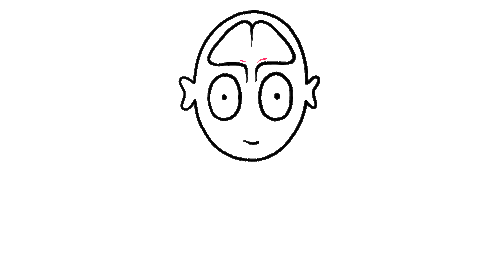
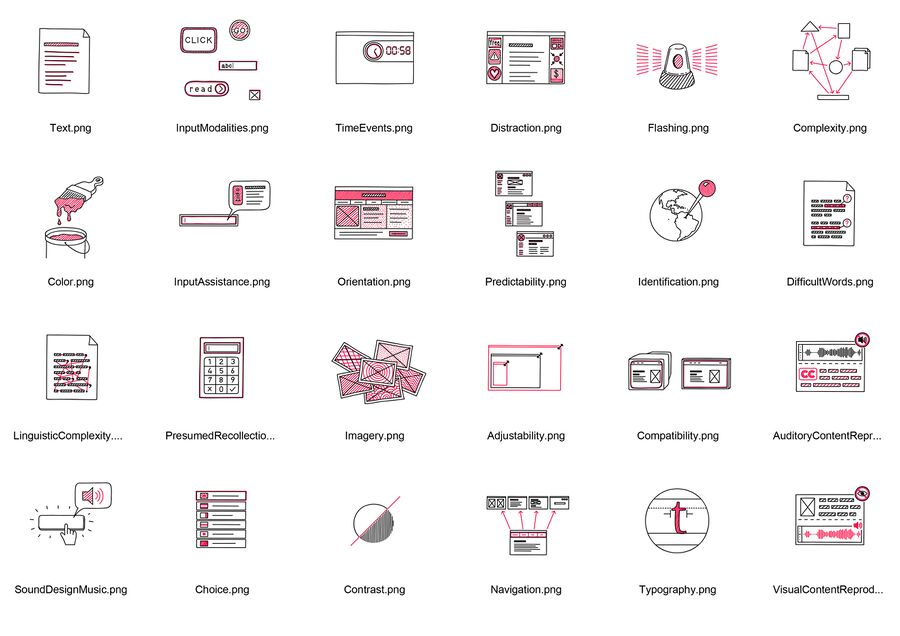
During the whole process, I continued to work on illustrations. Both animated ones depicting "user skills" and still ones which show "aspects of websites".
Final Outcome
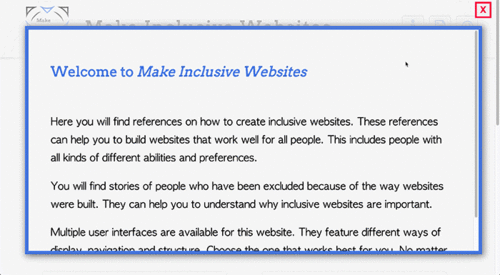
Make Inclusive Websites is a web index that helps to create websites that work well for a variety of people with diverse abilities. It provides many references to helpful websites, such as texts, tutorials or tools. These are integrated into an environment that provides an easy entry into this complex topic.
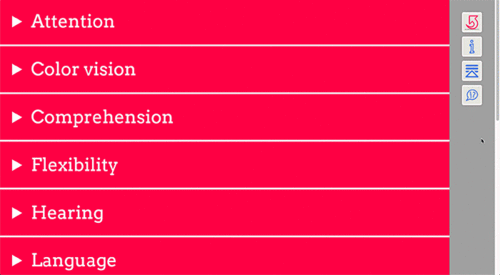
Make Inclusive Websites is also a speculative proposal for a different way of making web content accessible and an invitation to discuss about it. The idea is to move away from a one-size-fits-all mentality, yet not put users in the responsibility of going through complex adaptation processes that may be barriers. Make Inclusive Websites proposes the collaborative creation of a variety of different interfaces that allow the same web content to be accessed by a variety of users without the need for much adaptation.
[Thesis - Make Inclusive Websites]
[Home - Make Inclusive Websites]
[Forum - Make Inclusive Websites]
[Globe - Make Inclusive Websites]
[Fold Out - Make Inclusive Websites]
[UI Options - Make Inclusive Websites]

