User:Thijshijsijsjss/Pen Plotting Panache/3D Movie
The first ever fully pen plotted 3D movie. Pen plotters are making the virtual a reality.
(306 days ago, on 2024-05-29, I wrote a ptmomnbm about this idea)
Why pen plot a movie?
There's a friction in the way current (computer) animated movies are produced. Just like in any major tech field, there's a continuous push for seamlessness that mimics real life as closely as possible. This results in obfuscation of labor, of technology and our relation to and with it.
Pen plotters expose this friction: they are machines, and so we expect them to possess the machine's perfect seamlessness. Yet they do not. They are canonically machinal, yet they are flawed. Their works are made with a careful and hand-made quality, while being explicitly produced by a machine.
I am passionate about animation, and a layperson. A tradition of hand-illustrated animations is practices by a select few. These projects tend to be impressive. They are also inaccessible to many to make: they tend to require a lot of labour, a lot of skill and, hence, a lot of funds. I don't have funds, and my skills are questionable. But I do have labour to dedicate, and a passion for plotting.
Test Animation Workflow
2025-03-29, I prepared and pen plotted 16 frames for a test animation. These were scanned and digitally sequenced on 2025-03-31. Here's how that was done.
plotter.vision
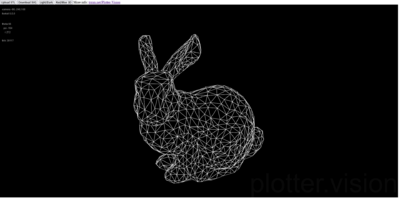
plotter.vision is a project by Trammell Hudson for 'hidden wire removal from 3D STL files to SVG files that are quitable for plotting' (according to the Git repo). It allows a user to load an STL file, move it, and download a 2D projection in SVG format. Crucially, it includes a 'red/blue mode' to be used for Anaglyphic 3D.

|

|
For the test animation, I counted the number of rotational increments the default model required for a full revolution (64). Deciding I would do 16 frames, I then made an SVG download every 4 increments.
Inkscape
As the plotter.vision output is SVG format, we can easily load it in Inkscape. Inkscape has the amazing functionality to translate SVG to HPGL, and can send this to a plotter.
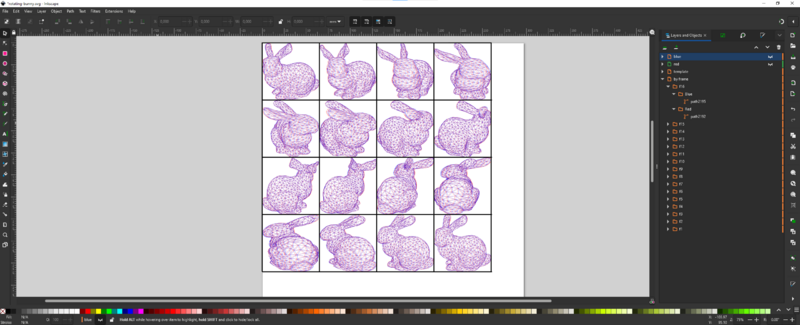
- Make a raster to position the frames. In my case: 4x4 frames of 65mm width and height. Place this in a layer 'Template'.
- Import all SVG to Inkscape into a layer 'By Frame'. Each is a folder with two nested folders: Red and Blue, containing the red and blue paths respectively.
- Optional: I positioned them all at (0,0) to verify the frame order.
- Scale all SVGs to your frame size (in my case: 65x65mm)
- Position all frames (in my case going top-left to bottom-right). The actual position doesn't matter much, as long as you know what frame comes when when assembling later. But I would recommend some order as not to get confused.
Now, we have everything we need in the right place! However, we can make things a little easier for ourselves to plot. In particular, we'd like to plot all red frames in one go, and similarly plot all blue frames in one go.
- Create a layer 'Red' and another layer 'Blue'.
- Copy all contents of 'By Frame' into 'Red', and delete all nested layers called 'Blue'
- Copy all contents of 'By Frame' into 'Blue', and delete all nested layers called 'Red'
- Create an alignment thingie at (0,0) for both the Red and Blue layer.
Plotting
After our preparations, plotting should go smoothly! Instruction for plotting through Inkscape have been documented here. Some notes:
- I plotted with the Template layer visible, so that there would be clear lines to cut or align the frames.
- For no reason in partcicular, I plotted Red first and then Blue.
- The red and blue layer both took about 50 minutes to plot.
- The SVG paths were amazingly nice and quite efficient. The Inkscape HPGL conversion follows the paths faithfully, so this is quite important.

|

|

|
Scanning and cutting
At first, I had planned to physically cut the frames and make a flipbook out of them. After plotting, I decided not to because (1) alignment imperfections made the frames bleed into each other, and (2) I quite liked the sight of all frames together. So for this test, I went with a digital animation. This went as follows:
- I made a scan using the WdKA's office printers.
- I opened the PDF scan on my machine.
- I opened paint.net.
- For each frame, I...
- created a new paint.net layer with 50% opacity,
- took a screenshot from the PDF,
- pasted it into the new paint.net layer,
- carefully aligned it with the previous frame underneath,
- set the new layer's opacity to 100%,
- and saved the new layer seperately.
Making a GIF
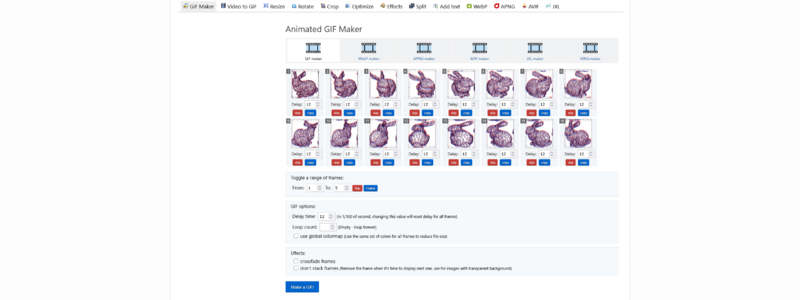
Finally, I used EZgif.com to make the frames into a GIF. Every frame is shown 12/100th of a second.
What's next?
Some ambitions:
- Host a movie screening. Probably at the Blaak movie room. If successful, reach out to venues outside of school.
- Have a more interesting film -- maybe a different subject, maybe a little longer
Some questions:
- Keep it digital, or build a mutoscope?
Some challenges:
- Currently, by way of using plotter.vision, we can only animate static objects. Moreover, manipulation of these objects is a little finnicky. One option would be to write my own code, but this would be a great endeavour, including:
- loading STL or OBJ files in processing (easy, see here)
- setting camera and objects animation paths (doable, see here and here)
- implementing a hidden-line removal algorithm (hard, maybe start here?)
- making (anaglyph) svg projections for every n frames (hard (hard), this is how Trammell Hudson does it)


