User:Roelroscama/trim2/protoyping2
Roel Roscam Abbing, Trimester II, 2012
Traceroute maps II
Description
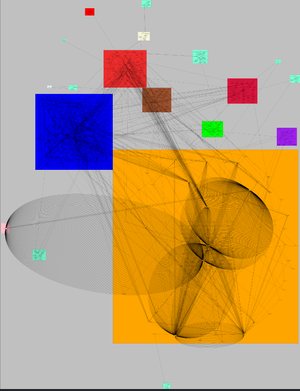
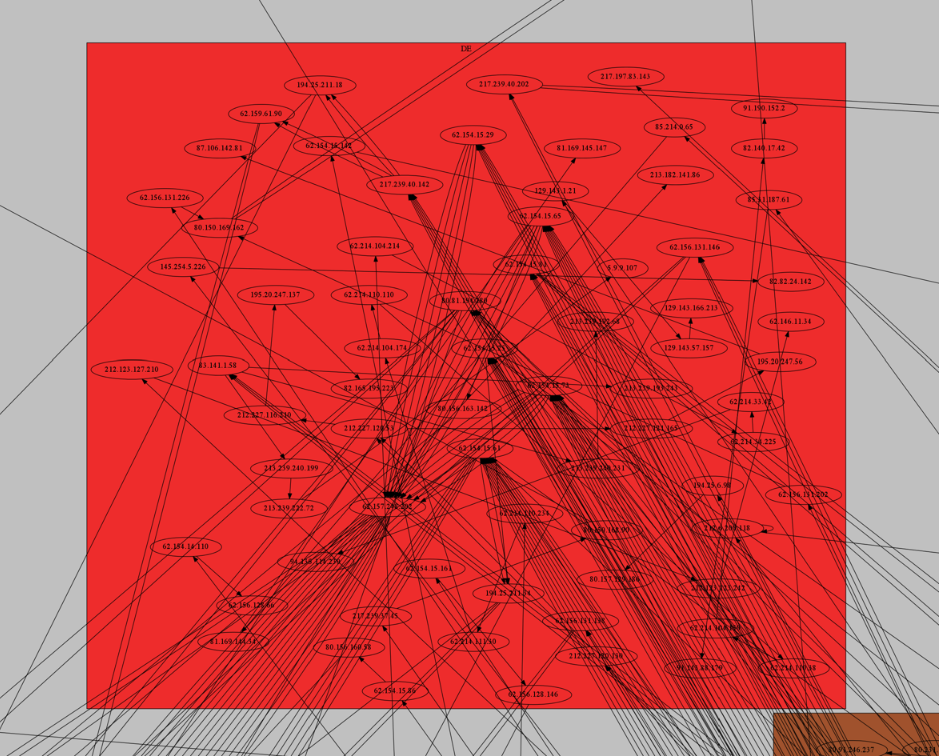
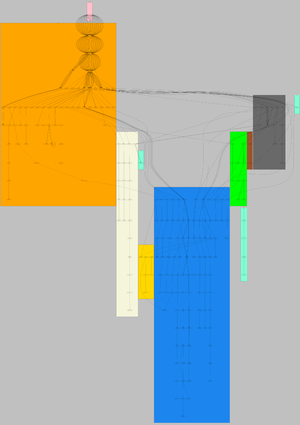
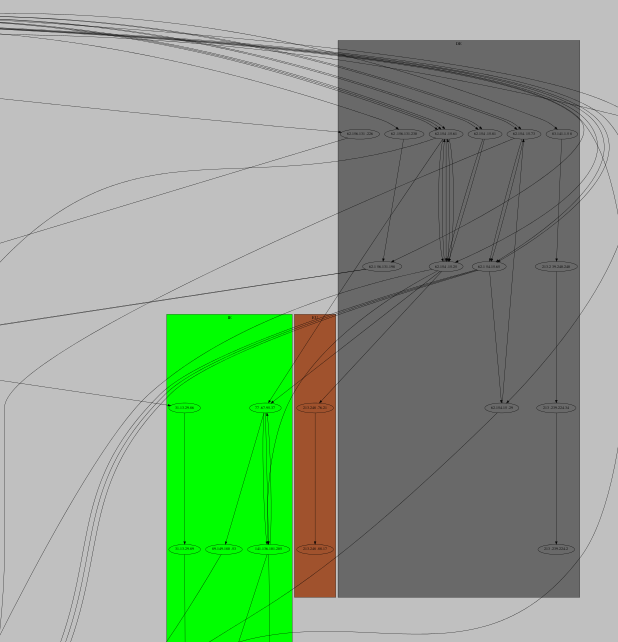
A continuation of Trim1's prototyping project where I try to visualize all the countries my data travels through while I surf the web. At the beginning of the trimester I managed to produce a map of a week's worth of browsing history. This map was huge, completely illegible and chaotic. It seems that graphviz's layout algorithms have a lot of trouble handling that amount of data. So to make the data more legible and better to visualize I started making daily records of my browsing history. With these daily records I could make daily maps that are more structured and legible.
First attempt
Later attempts
Other
A Dotcom Index
Description
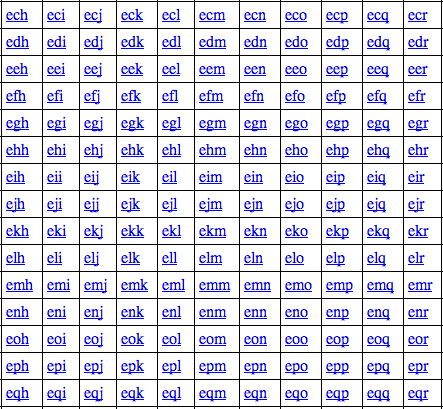
As part of the work on the EMO's Web Exploration and Cartography I wrote a script that would generate all possible '.com' domain names. A clickable interface of all these combinations creates a different way of navigating and exploring the web. Like here: http://www.roelroscamabbing.nl/dotcomindex.html
Media
watch: http://www.roelroscamabbing.nl/dotcomindex.mov
Code
from itertools import product
chars = "abcdefghijklmnopqrstuvwxyz1234567890-"
for n in xrange(253):
    for comb in product(chars, repeat=n):
        i = ''.join(comb)
        print 'http://www.'+i+'.com'

