
User:FluffyDunlop/Proposal: Difference between revisions
FluffyDunlop (talk | contribs) No edit summary |
FluffyDunlop (talk | contribs) No edit summary |
||
| Line 62: | Line 62: | ||
From here the visualization research started. I looked at different ways to get a detailed curve out of the wave files, and the best way that worked for me was to import the audio in After Effects and apply the Wave Form filter to a solid and link the filter to my measurements. This gave me a tweak able visualization, where I could change the amount of points, lines, height and offset of the audio file. After I exported a Tiff image with the waveform, I imported the image in Adobe Illustrator to trace the image into a spline. With the spline of each measurement (8 total) I created a sphere like object in autodesk maya. This method if done with only 4 measurements gives a less detailed object to work with, this was the main reason to go from 4 measurements to 8. | From here the visualization research started. I looked at different ways to get a detailed curve out of the wave files, and the best way that worked for me was to import the audio in After Effects and apply the Wave Form filter to a solid and link the filter to my measurements. This gave me a tweak able visualization, where I could change the amount of points, lines, height and offset of the audio file. After I exported a Tiff image with the waveform, I imported the image in Adobe Illustrator to trace the image into a spline. With the spline of each measurement (8 total) I created a sphere like object in autodesk maya. This method if done with only 4 measurements gives a less detailed object to work with, this was the main reason to go from 4 measurements to 8. | ||
<center><gallery> | <center><gallery> | ||
File: | File:Spline_From_Illustrator.png|Splines as exported from Illustrator | ||
File:Maya_1.gif|Splines imported into Autodesk Maya and shaped in a spherical setup | File:Maya_1.gif|Splines imported into Autodesk Maya and shaped in a spherical setup | ||
File:Maya_2.gif|The gaps between the splines are now filled and the visualization is complete | File:Maya_2.gif|The gaps between the splines are now filled and the visualization is complete | ||
| Line 69: | Line 68: | ||
</center> | </center> | ||
Foundings.<br> | |||
First thing that I found out is that a multiple speaker setup is quite hard to do, and makes thing unnecessary complex. The best way is to stick with multiple measurements trough the placement of 1 speaker and 1 microphone. I have measured on an even horizontal level, it may also be a good idea to go in height directions. Moving speakers up and directing outwards more in a 360 degrees spherical angle.<br><br> | |||
The moment the wave form is analyzed with the After Effects method, the measurements will loose the 1:1 accuracy. From here on out | |||
<center>Next Step.</center> | <center>Next Step.</center> | ||
Revision as of 11:50, 26 November 2014
My research focuses on the possibilities that sonology & computer models can offer for the development of sculptures (2d or 3d) and awareness of places and spaces. It will give the viewer an object to look at and perceive the room in a different way. The way the room is visualized is trough the use of reflecting sound frequencies. This idea comes from a method, called impulse response. It is a method that I frequently use in my sound design practice. With the information that the impulse response gives, a sculpture is created to visualize the acoustic properties of that space.
The sculpture will be calculated and constructed in a 3d model by a computer and could be made in a physical object. The way the transition of a 3d model to a physical one is conceived needs to be determent, there are more ways of doing this and the size of the sculptures has a huge role in this.
The outcome of this research will be presented in the exposition gallery. The form of the presentation could be pictures, sculptures or both
The research starts in two directions that need to be one in the end. The first direction is the place or space and the second is the method of visualization. What I found in my prototyping research stage is that you can't finish one direction without another. So it is important to develop them both and see where the different directions merge.
Impression of the sculpture in a space
Impression of the sculpture in a space


With this project I’m aiming to surprise the viewer with a new perception of a space, and to connect the viewer to the space in a different way. The idea of engaging the viewer with the space comes from the idea that there are acoustics properties that you might not be aware of. Through this properties of a space I can visualize my research and let the viewer be engaged and connect to the space in different way
Within the early presentations of my proposal to my peers and pzw staff, I found out that the subject of impulse response is hard to grab. So the engagement with the viewer has some other aspects than just "presenting" objects or visualizations. I could choose to educate in the case that the impulse response technique plays a more narrative role. Or I could choose to leave the technical explanation out, this in case that the work is strong enough and doesn't need any technical details to explain the work. What I need to tell in a technical aspect is defined by the outcome of my research.
The idea of engaging the viewer with the space comes from the idea that there are acoustics properties that you might not be aware of. Through this properties of a space I can visualize my research and let the viewer be engaged and connect to the space in different way
An impulse response is a method to calculate the reverberant properties of a certain space. Trough the playback and recording of frequencies ranging from 0hz to 50kHz the resonating properties and thus the reverberant character of the space is calculated. Imagine a space where at one end speakers are placed and on the other end a microphone. Trough the speakers every usable sound frequency is played back and simultaneously recorded through the microphone. The signal that has been recorded through the microphone is now very important, because it contains every frequency that we've played back and all the reflections of the room that came within the recording. If we let the computer subtract the original frequencies from the recorded frequencies trough a convolution method, we are left with the Impulse Response of that room
Below are the basic sound examples of a Impulse Response technique.
A clean sweep to play - [A sine sweep from 20Hz to 20kHz]
A sine sweep from 20Hz to 20kHz recorded trough a microphone in a room - File:R1.ogg
Impulse Response through deconvolution method - File:Jar Response.ogg
These pictures show a representation of an impulse response. The way in witch the impulse response is shown is called a waterfall diagram.
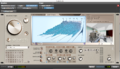
Waterfall diagram of a Impulse response from a kitchen (measured in dB and Frequency)
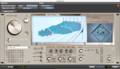
Waterfall diagram of a Impulse response from an auditorium (measured in dB and Frequency)


The use of impulse response technique is one that I use daily in my work as a sound designer. Either to merge instruments together in a musical composition
or to use within sound for picture applications, like recreation of rooms, microphones and telephone systems or to be applied to automatic dialogue recording to fit a scene better. With my daily use of impulse responses I can say I'm quit familiar with them and the technique.
I started by setting up speakers in a 90 degree order with a microphone in between. This system, if mirrored and pointed to the opposite side of the room, can provide me with 4 impulse responses (1 for each speaker repeated once)
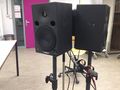
Initial setup

I found out that when I put the outcome of these four measurements trough my visualization workflow, that the amount of measurements was not enough to give a detailed model of the room. So I quickly abandoned my 2 speaker setup with 4 measurements. And went for a single speaker setup with 8 measurements. More work to get the angle of the speaker right but much more information due to more measurements. The distance of the microphone to the speaker is equal to all measurements and gave some weird mic placements within the measurement technique. I decided to leave the room in the way as I found it and to not mess around with furniture between measurements.
Second setup
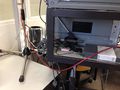
Measurement 5 gave me some interesting microphone placement
Keeping equal distance


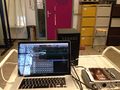
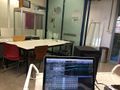
These are the recordings and the 8 measurements of that particular space (room 2.9 wdka)
Measurement 1
Measurement 2
Measurement 3
Measurement 4
Measurement 5
Measurement 6
Measurement 7
Measurement 8
From here the visualization research started. I looked at different ways to get a detailed curve out of the wave files, and the best way that worked for me was to import the audio in After Effects and apply the Wave Form filter to a solid and link the filter to my measurements. This gave me a tweak able visualization, where I could change the amount of points, lines, height and offset of the audio file. After I exported a Tiff image with the waveform, I imported the image in Adobe Illustrator to trace the image into a spline. With the spline of each measurement (8 total) I created a sphere like object in autodesk maya. This method if done with only 4 measurements gives a less detailed object to work with, this was the main reason to go from 4 measurements to 8.
Splines as exported from Illustrator
Splines imported into Autodesk Maya and shaped in a spherical setup
The gaps between the splines are now filled and the visualization is complete


Foundings.
First thing that I found out is that a multiple speaker setup is quite hard to do, and makes thing unnecessary complex. The best way is to stick with multiple measurements trough the placement of 1 speaker and 1 microphone. I have measured on an even horizontal level, it may also be a good idea to go in height directions. Moving speakers up and directing outwards more in a 360 degrees spherical angle.
The moment the wave form is analyzed with the After Effects method, the measurements will loose the 1:1 accuracy. From here on out
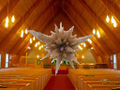
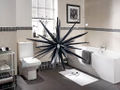
a more natural way of representing the space. The sound originates from the center of the room and the reflections are measured in every direction. This results in an explosion like sculpture.
Depending on the size of the room where the impulse response is taken, the size of the sculpture may be different. Bigger rooms have a larger reverb so the sculpture is bigger. I’m aiming at impulse responses from common rooms, toilets, bathrooms, classrooms and larger places like churches or halls.
Depending of the size of the sculpture the sculpture is either 3d printed or cnc’ed out of Styrofoam. To enhance the visualization and to obscure any blemishes that occur during the process a coating of paint is applied.
The viewer will first see the object floating mid-air in the exhibition space. And see the pictures on the wall of similar sculptures, by reading the explanation of the project it should come clear why the sculptures are made and what they represent.
Bibliography:
Impulse Response as explained by AudioEase
Audio Check Test Tones
Paper Mockup Software Pepakura