
User:ØverLørd/Complot: Difference between revisions
(made som sick edits) |
(added section on cmyk convertion and sepparation) |
||
| (6 intermediate revisions by the same user not shown) | |||
| Line 1: | Line 1: | ||
== '''The complot or how I learned to stop worrying and love the machine'''== | == '''The complot or how I learned to stop worrying and love the machine'''== | ||
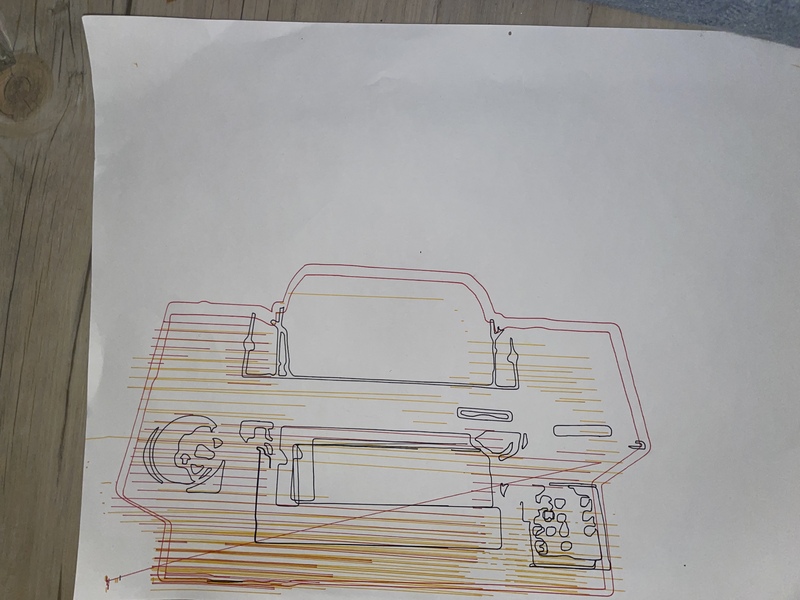
[[File:Naaerdetsent-2.jpg|800px]] | |||
<br style="clear:both;"> | |||
<small>Graphics allegedly improve communication</small> | |||
=== First contact === | === First contact === | ||
''The Epic of "Interaction station Alignment Issues", a story of an encounter between the machine and the non-machine (more-than machine encounters)'' | ''The Epic of "Interaction station Alignment Issues", a story of an encounter between the machine and the non-machine (more-than machine encounters)'' | ||
<br><br> | <br><br> | ||
''The plotter labeled "Interaction station Alignment Issues" had been collecting dust in a corner of the XML. Then one day came an eager adventurer who had heard whispers of these ancient machines, that could imitate the human hand and draw with incredible precision without ever getting fatigued. Before even attempting to face these ancient behemoths, the adventurer consulted with one of the High-warlocks of Xpub(Manetta), In order to acquire the spells(Chiplotle) required so that the adventurer could speak the language of the machines.'' | ''The plotter labeled "Interaction station Alignment Issues" had been collecting dust in a corner of the XML. Then one day came an eager adventurer who had heard whispers of these ancient machines, that could imitate the human hand and draw with incredible precision without ever getting fatigued. Before even attempting to face these ancient behemoths, the adventurer consulted with one of the High-warlocks of Xpub(Manetta), In order to acquire the spells(Chiplotle) required so that the adventurer could speak the language of the machines.'' | ||
<br> | |||
<br> | |||
[[User:ØverLørd/A_Plotters_Diary|Here you can be (un)informed about a particular plotter]] | |||
===The early plots=== | ===The early plots=== | ||
| Line 88: | Line 92: | ||
<br> | <br> | ||
=== | ===Wrapping numbers in hpgl=== | ||
'''Different programming languages can be used to "generate"-hpgl code, by "generating" some values, and then wrap these numbers with hpgl syntax in a string.''' | |||
Here is a javascript that make some circles using some trigonmetry to make the values oscillate between plottable values. | |||
<pre> | |||
//define variables – the parameters of the plot e.g. position, radius, resolution etc. | |||
let x = 0; | |||
let y = 0; | |||
let rad = 5; | |||
let res = 30; | |||
let out = "IN;SC0,141,0,100;PU;" | |||
for(let i = 10; i < 200; i++){ | |||
// console.log(Math.sin(i/10)+""); | |||
let sini = Math.sin(i*0.27); | |||
let cosi = Math.cos(i*0.32); | |||
// console.log(sini); | |||
// mess with the parameters od the plot | |||
x = 70+cosi*58; | |||
y = 50+sini*38; | |||
// rad = 5+sini*2; | |||
rad = 3+cosi*2; | |||
// make the string of hpgl with the parameeters you messed with | |||
out += "PA"+x.toFixed(1)+","+y.toFixed(1)+";\nCI"+rad.toFixed(1)+","+res.toFixed(1)+";" | |||
} | |||
console.log(out); | |||
</pre> | |||
[[File:Genplot2.jpg|300px]][[File:Genplot3.jpg|300px]] | |||
<br style="clear:both;"> | |||
<small>plots made by wrapping generated values in hpgl</small> | |||
During the machzine-camp this technique was used to make a web-application that generates a plot of the noise leves pr time. | |||
[[File:Research-12.jpg|600px]] | [[File:Research-12.jpg|600px]] | ||
<br style="clear:both;"> | <br style="clear:both;"> | ||
<small>noise-levels plotted at zine-camp</small> | <small>noise-levels plotted at zine-camp</small> | ||
This same technique has layd the foundation for an the development of a text to plot -layout tool. it os still a bit uncertain exactly what the purpose of this tool will be. But hopefully it will be regarded as the FLOSS-indesign for plotters.. | |||
[[File:Genplot1.jpg|600px]] | |||
<br style="clear:both;"> | |||
<small>noise-levels plotted at zine-camp</small> | |||
here is the current script, though the math needs to revised, and experiments conducted in order to make it work "properly" | |||
<pre> | |||
from chiplotle import * | |||
import os | |||
import time | |||
import random | |||
print("Start the script") | |||
gutter = 5 | |||
leading = 2.1 | |||
top = 4.5 | |||
left = 50 | |||
charw = 1 | |||
charh = 3 | |||
columns = 2 | |||
textfile = 'testetekst.txt' | |||
colw = (100-left-(columns+1)*gutter)/columns | |||
linewidth = int(0.8*0.66*colw/charw) | |||
#apparantly charw of 1 does not mean 100chars fit in the with(defined to be '100'), more like 70, whereeas the 0.7* | |||
numlines = int(100/(charh+leading)) | |||
#intxt = "This is a piece of text that I would like to make plotable. Let's see what we can do? This is a piece of text that I would like to make plotable. Let's see what we can do?" | |||
instr = open(textfile, 'r').read().replace("\n", " ") | |||
split = instr.split() | |||
split[-1] += "#@!" | |||
lines = [] | |||
out = "" | |||
for a in split: | |||
if a != split[-1]: | |||
if len(out)+len(a)>linewidth: | |||
lines.append(out) | |||
out = a+" " | |||
else: | |||
out += a+" " | |||
elif len(out)+len(a)>linewidth: | |||
lines.append(out) | |||
lines.append(a) | |||
out = "" | |||
else: | |||
out += a | |||
lines.append(out) | |||
out = "" | |||
#print(lines) | |||
plotter = instantiate_plotters()[0] | |||
plotter.write("IN;SC0,100,0,100;PU;SR"+str(charw)+str(charh)+";DT*;") | |||
x = gutter + left | |||
y = 100 - top | |||
count = 1 | |||
print(numlines) | |||
print(linewidth) | |||
for line in lines: | |||
if count%numlines == 0: | |||
x += gutter+linewidth | |||
y = 100 - top | |||
plotter.write("PA"+str(x)+","+str(y)+"*;") | |||
plotter.write("LB"+line+"*;") | |||
print("new column") | |||
count += 1 | |||
y -= leading | |||
else: | |||
plotter.write("PA"+str(x)+","+str(y)+"*;") | |||
plotter.write("LB"+line+"*;") | |||
#plotter.write(shapes.label(""+line,0.5,0.6)) | |||
y -= leading | |||
count += 1 | |||
print('line printed') | |||
</pre> | |||
===Pen Plotter/Plotting Parties=== | |||
[[File:ppposter2.jpg|800px]] | |||
<br style="clear:both;"> | |||
<small>Pen plotted posters crafted with HPGL, plotted with black felt-tip pen and red fountain-pen</small> | |||
[[File:ppposterospxpub.jpg|800px]] | |||
<br style="clear:both;"> | |||
<small>digitized version</small> | |||
===Emulating conventional printer with pen plotter=== | |||
As the exploration of what the pen-plotter can do advanced, the question of how photographies could be represented utilizing only lines (or points (as this is what the pen plotter produces)). Possibly in extension of the experiments with uni-direction line plots, the idea of making pen plotted crosshatches. — An image comprised of lines that cross in different direction, the density of the lines determine the image's appearance. — Was manifested. <br><br> | |||
This endeavor was undertaken by Thijs, and surely, a processing script that takes an image and makes a crosshatched version, based on the darkness/lightness in the image, was born. The program then outputs the different layers of the crosshatch, as seprate (as Im using a legacy version of the program, it outputs "fake svgs" ad in pixel-images wrapped in a svg file).These layes can then be all put into inkscape and traced(to true vectors), and exported as hpgl. <br><br> | |||
''So what to do if you want a multi-colored image?'' <br> | |||
To undertake this process it's important to understand a little bit of light. Light which are electromagnetic waves, com in a wide specter. The human eye can only perceive wavelengths between ~400nm - ~700nm wavelengths… whatever. <br> | |||
So anyways the imagery on your screen is comprised of tiny pixels which can output red green and blue light (rgb). The combination of these three colors of light, in different amounts allows your eye to perceive all the different colors. If you have a "100%" red, "100%" green and "100%" blue, the light will b appear white, and vise-versa if it's all at "0%" it would be black. Therefore images are encoded with ''color profiles'', sRGB is a common profile, and as the name suggests it means that the image is built up by red, green, and blue colors. So in order to make a multicolored plot, one can extract the different ''color channels'', and layer them over each other. <br><br> | |||
'''But wait!''' – As we know the pen plotter does not produce a screen emitting light, but rather lays down pigment that absorb and reflect light. So if we were to plot the RGB layers, the colors dont add to each other, but rather subtract. As in, if both red green and blue is present in a point of the image, it should appear as white like on the screen, but in pigment/ink would appear like a dark-brownish color. So for printing we can't use RGB to get accurate colors, but we use CMYK (Cyan, magenta, yellow, key) instead. This is utilized for a variety of printing techniques like silk-screen printing, risography and offset-printing. (this could surely be more unpacked, but im getting borded)<br><br> | |||
So how can you convert your RGB image to CMYK, and then how doy separate the colorchannels? with Magick of course! utilizing the terminal-based image-editing software Imagemagick this can be done with two simple commands. <br> | |||
''1. First of all you will need to install the program: https://imagemagick.org/script/download.php'' | |||
<br><br> | |||
''2. Open the terminal and navigate your way with the cd command to the location of the image you want converted.'' | |||
<br><br> | |||
''3. to convert the image to cmyk use'' '''$ convert rgb-image.jpg -colorspace CMYK cmyk-image.jpg''' <br> | |||
This should give you a new image, where the colors look a bit more dull, this could allegedly be corrected for using color-profiles, more research is needed to fully understand how to do this. ref: https://www.imagemagick.org/Usage/formats/#profiles | |||
<br><br> | |||
''4. To separate the image into color channels simply use'' '''$ convert cmyk-image.jpg -separate channel%d.jpg''' | |||
<br> This will output 4 images, in black and white, that represent the color channels. The darker areas of each channel corresponds to the more cyan, magenta, yellow or black(key) areas of the image. | |||
<br><br> | |||
Now just feed each of the images through the processing script, and voila! you have a cmyk plottable image… | |||
[[File:nothingness.jpg|800px]] | |||
<br style="clear:both;"> | |||
<small>digitized version</small> | |||
Latest revision as of 12:38, 15 May 2024
The complot or how I learned to stop worrying and love the machine

Graphics allegedly improve communication
First contact
The Epic of "Interaction station Alignment Issues", a story of an encounter between the machine and the non-machine (more-than machine encounters)
The plotter labeled "Interaction station Alignment Issues" had been collecting dust in a corner of the XML. Then one day came an eager adventurer who had heard whispers of these ancient machines, that could imitate the human hand and draw with incredible precision without ever getting fatigued. Before even attempting to face these ancient behemoths, the adventurer consulted with one of the High-warlocks of Xpub(Manetta), In order to acquire the spells(Chiplotle) required so that the adventurer could speak the language of the machines.
Here you can be (un)informed about a particular plotter
The early plots

Two plots made shortly after I had setup chiplotle on my computer
When the interface between the computer and plotter was set up, exporting some simple svgs and boxes to hpgl (with Inkscape) and plotting them was a good way to be familiarized with the translation from screen to paper.
With a limited understanding for how something could be plotted, a collaborative drawing was made and then plotted, the workflow was something like this:
- Draw a drawing, for highest fidelity plots use hi contrast colors, with a sharp line.
- digitize drawing, either by photo or scan (or any other creative you can imagine).
- (optional) use image-editing software (the likes of gimp) to increase contrast, or use thresholds to determine shapes to be traced.
- Trace the image so that it becomes vector graphics (lines that know no resolution).
- Save vector graphics as ".hpgl"-format in Inkscape.
- with chiplotle use command plotter.write_file('yourhpglfile.hpgl') nad watch your plotter come alive.
self plotret
Plotting horses


Drawing Horses In Your Own Way
Through incantations in the forms of ".hpgl"-files and chiplotle3 set up in a virtual environment (don't ask me why, it just happened to work out for all parties involved (why do it easy when you can do it hard?)). bridging the generational gap between my now state-of the art computer with the then state of the art pen plotter a series of adapters are engaged: from the plotter a custom parallel port to serial converter is connected to a USB to RS232 DB9 Serial Adapter Cable, which in turn is connected to a USB to USB-C adapter which plugs into the laptop. Allowing the two machines converse over a plate of chiplotle3. This gave me the opportunity to command the mechanical arm wielding the pen.
After getting to know each other I realized something was not as it should. The pen plotter would stop midway and the yellow(some would even say orange) light, labeled "error" would start blinking. A mangled piece of characters and numbers would then appear in the terminal window, maybe a cry for help, or an apology from the plotter, suggesting we try things differently.
To get back in the plotting saddle chiplotle and the machine must be restarted (in the reverse order). Sometimes the machines also need to be disconnected and reconnected (some personal space is always helpful). Even after all these steps there is a risk of the machine immediately go back in the same catatonic error-state, when asked to plot something new. maybe I should have listened more carefully to the warnings of "alignment issues" and "craps out midway"?
After repeating this choreography for hours I made som observations:
1. The machine seemed to stop randomly every time, even when the same plot was attempted.
- this may suggest that the issue was rather of a mechanical-nature as opposed to to electrical/software-related.
2. Smaller plots were more reliably plotted.
- This may suggest that the issue was related to movement, as the bigger the plot, the more movement the more likely to error the machine was.
3. For some plots there were some specific regions/lines where the plot would fail, I noticed a pattern that these were usually lines that were parallel to the long edge of the paper.
- This may suggest that the issue was related to the movement of the paper. (The machine plots in an Cartesian coordinate system, where the movement of the pen gives moves it through one axis (let's say "y") and a roller moves the paper in the other axis (let's say "x")).
Based on these observations I formed a hypothesis that the reason the plotting machine stumbled, was the fact that like most old things their agility declines, affecting how certain task can and/or can't be performed. More specifically that it stops because its ability to move paper in the "x-axis" was compromised. To further test this hypothesis I tried to move the roller that is supposed to move the paper, when it had errored. To my (not so?)surprise it seemed stuck, and I could just barely move it with the application of force. (I have to note that this was not a pleasant experience, as for all I knew this could really damage the machine, but desperate times – desperate means (or something). At this point I knew ish what was wrong, that the machine struggles with moving the paper, but I did not have the courage or knowledge to act upon the discovery and "repair" the machine. It was still able to plot the line on the paper, so maybe I was the one who needed to change?
In order to plot I was required to be more considerate of the needs and quirks of this specific pen plotter. So how could this be achieved? I needed to reduce the amount of movement in the x-axis as much as possible. To accomplish this I constructed graphics made of lines only in one axis. This was done with image-manipulation software the likes of GIMP or Inkscape. By separating different color channels, or different leves of lightness/darkness in an image or drawing, and then making these layers into shapes with a threshold, and use the outlines of the shapes to mask a layer of parallel digitally constructed vector-lines. This strategy proved effective, and the amounts of errors was greatly reduced.
A new challenge appeared after this technique was implemented. The fact that the machine still would fail, made it so for certain plots it would never reach the end of a plot even after many tries. When you restart the plot it starts from the beginning again, putting the plotter and plot-operator in a sisyphusian position, of never reaching the end of a plot. A work-around for this was for in the event of an error to manually remove the code that was already plotted in the hpgl file. For this one has to know what you can safely remove from the hpgl file without corrupting it, and a good sense of the nominal relation between lines plotted and lines to plot, and their coded incarnation on the computer (If it looks like half the image is plotted remove about half of the hpgl code(maybe a little less, just to be sure)).
After developing this understanding relationship with the plotter I was able to consistently plot as long as a I adhered to the negotiated protocols. In it´s limitations layed vaste opportunities to be explored.
The plotter did only know how to hold very odd and specific pens. Fortunately any pen plotter can hold any pen with a little bit of tape and tac-it (not verified) all you do is stick it to one of the odd and specific pens. In this process one has to careful as so the tip of the desired drawing-utensil lines up with the tip of the undesired odd and specific pen. Thus ensuring the right amount of pressure. A byproduct of this is that you get a trippy and cool shadowed effect, since there are now two pens drawing rather than one. If this is not to your liking you can use an empty odd and specific pen, or dissect an unused odd and specific pen and remove the "drawing-parts".

Horse drawings made to line art
Now equipped with all the tools explore a lot of shapes and colors together with the HP 7475A, all I needed was some content to plot. All of these events unfolded in a time where drawing horses felt important to me, therefore I had received a Swedish children's book about horses from my sister as a gift, to help me in my horse-studies. The book contained a small tutorial on how to draw a horse, whilst still suggesting that horses can be drawn in many ways, and one should find explore your own way to draw a horse. Rather than to confine to some horse-drawing-paradigm established by the shadow society. This passage of the book moved me, and I had an urge to share this wisdom. Thus I recreated this drawing tutorial in plotted form. Following the tutorial myself drawing digitally. This step by step tutorial covers one side of a A3 sheet and the other is filled with collages of different horse-drawings I have made plotable, varying the colors and motives, creating "unique" prints, that still confine to the same logic and share the same mythos.

the passage from the Swedish childrens book plotted

the horse-zine folded up


book used for reference
Plotting with disabilities

changing pen every time the plotter throws an error
Wrapping numbers in hpgl
Different programming languages can be used to "generate"-hpgl code, by "generating" some values, and then wrap these numbers with hpgl syntax in a string.
Here is a javascript that make some circles using some trigonmetry to make the values oscillate between plottable values.
//define variables – the parameters of the plot e.g. position, radius, resolution etc.

let x = 0;
let y = 0;
let rad = 5;
let res = 30;

let out = "IN;SC0,141,0,100;PU;"

for(let i = 10; i < 200; i++){
//	console.log(Math.sin(i/10)+"");
	let sini = Math.sin(i*0.27);
	let cosi = Math.cos(i*0.32);
//	console.log(sini);
//	mess with the parameters od the plot
	x = 70+cosi*58;
	y = 50+sini*38;
//	rad = 5+sini*2;
	rad = 3+cosi*2;

//	make the string of hpgl with the parameeters you messed with
	out += "PA"+x.toFixed(1)+","+y.toFixed(1)+";\nCI"+rad.toFixed(1)+","+res.toFixed(1)+";"
}
console.log(out);


plots made by wrapping generated values in hpgl
During the machzine-camp this technique was used to make a web-application that generates a plot of the noise leves pr time.

noise-levels plotted at zine-camp
This same technique has layd the foundation for an the development of a text to plot -layout tool. it os still a bit uncertain exactly what the purpose of this tool will be. But hopefully it will be regarded as the FLOSS-indesign for plotters..

noise-levels plotted at zine-camp
here is the current script, though the math needs to revised, and experiments conducted in order to make it work "properly"
from chiplotle import *
import os
import time
import random

print("Start the script")


gutter = 5
leading = 2.1
top = 4.5
left = 50
charw = 1
charh = 3
columns = 2
textfile = 'testetekst.txt'


colw = (100-left-(columns+1)*gutter)/columns
linewidth = int(0.8*0.66*colw/charw)
#apparantly charw of 1 does not mean 100chars fit in the with(defined to be '100'), more like 70, whereeas the 0.7*
numlines = int(100/(charh+leading))


#intxt = "This is a piece of text that I would like to  make plotable. Let's see what we can do? This is a piece of text that I would like to  make plotable. Let's see what we can do?"

instr = open(textfile, 'r').read().replace("\n", " ")
split = instr.split()
split[-1] += "#@!"


lines = []
out = ""
for a in split:
    if a != split[-1]:
        if len(out)+len(a)>linewidth:
            lines.append(out)
            out = a+" "
        else:
           out += a+" "

    elif len(out)+len(a)>linewidth:
        lines.append(out)
        lines.append(a)
        out = ""
    else:
        out += a
        lines.append(out)
        out = ""
#print(lines)

plotter = instantiate_plotters()[0]
plotter.write("IN;SC0,100,0,100;PU;SR"+str(charw)+str(charh)+";DT*;")

x = gutter + left
y = 100 - top
count = 1

print(numlines)
print(linewidth)
for line in lines:

    if count%numlines == 0:
        x += gutter+linewidth
        y = 100 - top
        plotter.write("PA"+str(x)+","+str(y)+"*;")
        plotter.write("LB"+line+"*;")
        print("new column")
        count += 1
        y -= leading
    else:

        plotter.write("PA"+str(x)+","+str(y)+"*;")
        plotter.write("LB"+line+"*;")
        #plotter.write(shapes.label(""+line,0.5,0.6))
        y -= leading
        count += 1
        print('line printed')
Pen Plotter/Plotting Parties

Pen plotted posters crafted with HPGL, plotted with black felt-tip pen and red fountain-pen

digitized version
Emulating conventional printer with pen plotter
As the exploration of what the pen-plotter can do advanced, the question of how photographies could be represented utilizing only lines (or points (as this is what the pen plotter produces)). Possibly in extension of the experiments with uni-direction line plots, the idea of making pen plotted crosshatches. — An image comprised of lines that cross in different direction, the density of the lines determine the image's appearance. — Was manifested.
This endeavor was undertaken by Thijs, and surely, a processing script that takes an image and makes a crosshatched version, based on the darkness/lightness in the image, was born. The program then outputs the different layers of the crosshatch, as seprate (as Im using a legacy version of the program, it outputs "fake svgs" ad in pixel-images wrapped in a svg file).These layes can then be all put into inkscape and traced(to true vectors), and exported as hpgl.
So what to do if you want a multi-colored image?
To undertake this process it's important to understand a little bit of light. Light which are electromagnetic waves, com in a wide specter. The human eye can only perceive wavelengths between ~400nm - ~700nm wavelengths… whatever.
So anyways the imagery on your screen is comprised of tiny pixels which can output red green and blue light (rgb). The combination of these three colors of light, in different amounts allows your eye to perceive all the different colors. If you have a "100%" red, "100%" green and "100%" blue, the light will b appear white, and vise-versa if it's all at "0%" it would be black. Therefore images are encoded with color profiles, sRGB is a common profile, and as the name suggests it means that the image is built up by red, green, and blue colors. So in order to make a multicolored plot, one can extract the different color channels, and layer them over each other.
But wait! – As we know the pen plotter does not produce a screen emitting light, but rather lays down pigment that absorb and reflect light. So if we were to plot the RGB layers, the colors dont add to each other, but rather subtract. As in, if both red green and blue is present in a point of the image, it should appear as white like on the screen, but in pigment/ink would appear like a dark-brownish color. So for printing we can't use RGB to get accurate colors, but we use CMYK (Cyan, magenta, yellow, key) instead. This is utilized for a variety of printing techniques like silk-screen printing, risography and offset-printing. (this could surely be more unpacked, but im getting borded)
So how can you convert your RGB image to CMYK, and then how doy separate the colorchannels? with Magick of course! utilizing the terminal-based image-editing software Imagemagick this can be done with two simple commands.
1. First of all you will need to install the program: https://imagemagick.org/script/download.php
2. Open the terminal and navigate your way with the cd command to the location of the image you want converted.
3. to convert the image to cmyk use $ convert rgb-image.jpg -colorspace CMYK cmyk-image.jpg
This should give you a new image, where the colors look a bit more dull, this could allegedly be corrected for using color-profiles, more research is needed to fully understand how to do this. ref: https://www.imagemagick.org/Usage/formats/#profiles
4. To separate the image into color channels simply use $ convert cmyk-image.jpg -separate channel%d.jpg
This will output 4 images, in black and white, that represent the color channels. The darker areas of each channel corresponds to the more cyan, magenta, yellow or black(key) areas of the image.
Now just feed each of the images through the processing script, and voila! you have a cmyk plottable image…

digitized version