PythonGraphviz
Drawing Graphs with Python + Graphviz
- http://networkx.lanl.gov/pygraphviz/reference/agraph.html
- http://www.graphviz.org/doc/info/attrs.html
Installing
sudo apt-get install python-pygraphviz
Example
import pygraphviz

g=pygraphviz.AGraph(directed=True)
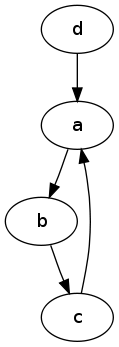
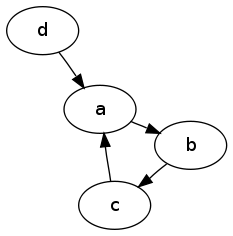
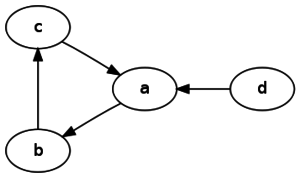
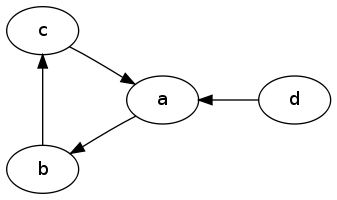
g.add_edge("a", "b")
g.add_edge("b", "c")
g.add_edge("c", "a")
g.add_edge("d", "a")

# draw the graph with various layout algorithms
g.draw('graph.png', prog="dot")
g.draw('graph2.png', prog="neato")
g.draw('graph3.png', prog="neato")
Subgraphs
g = pydot.Graph()
for c in cd:
    sg = pydot.Subgraph()
    sg.set_label(c)
    g.add_subgraph(sg)
    for nn in cd[c]:
        sg.add_node(pydot.Node(str(nn)))


