
Pen plotters: Difference between revisions
No edit summary |
|||
| Line 364: | Line 364: | ||
=Pen plot memes= | =Pen plot memes= | ||
[[File:Penplot-meme-1.jpg| | [[File:Penplot-meme-1.jpg|300px]] | ||
[[File:Penplot-meme-2.jpg| | [[File:Penplot-meme-2.jpg|300px]] | ||
[[File:Penplot-meme-3.jpg| | [[File:Penplot-meme-3.jpg|300px]] | ||
[[File:Penplot-meme-4.jpg| | [[File:Penplot-meme-4.jpg|300px]] | ||
[[File:Penplot-meme-5.jpg| | [[File:Penplot-meme-5.jpg|300px]] | ||
[[File:Penplot-meme-6.jpg| | [[File:Penplot-meme-6.jpg|300px]] | ||
[[File:Penplot-meme-7.jpg| | [[File:Penplot-meme-7.jpg|300px]] | ||
[[File:Penplot-meme-8.jpg| | [[File:Penplot-meme-8.jpg|300px]] | ||
[[File:Penplot-meme-9.jpg| | [[File:Penplot-meme-9.jpg|300px]] | ||
[[File:Penplot-meme-10.jpg| | [[File:Penplot-meme-10.jpg|300px]] | ||
[[File:Penplot-meme-11.jpg| | [[File:Penplot-meme-11.jpg|300px]] | ||
[[File:Penplot_meme_12.jpg| | [[File:Penplot_meme_12.jpg|300px]] | ||
[[File:Penplot-meme-13again.jpg| | [[File:Penplot-meme-13again.jpg|300px]] | ||
[[File:Penplot-meme-14.jpg| | [[File:Penplot-meme-14.jpg|300px]] | ||
=See also= | =See also= | ||
Revision as of 12:38, 9 February 2024
Plotters at XPUB

HP DraftPro EXL
A0+ pen plotter.
Currently borrowed from Varia, who borrows it from Gijs (OSP).
http://hpmuseum.net/display_item.php?hw=393
- state: works
- attitude: this plotter needs to have paper loaded before you start chiplotle; the center point lies at the right bottom of the paper, it works with negative numbers;
- demo plot: press
P1 + P2simultaneously (the buttons with a small 1 and 2) - user manual: http://www.hpmuseum.net/document.php?hwfile=3232 + http://www.hpmuseum.net/collection_document.php (list of HP museum user manuals, in case the download link above does not work)
- language: HPGL (HP graphics language)
HP 7475A
A4/A3 plotter
https://www.hpmuseum.net/display_item.php?hw=74
- demo plot: hold down the
P1 + P2keys and turn on the power - user manual: https://archive.org/details/HP7475AInterfacingandProgrammingManual
There are two of these at XPUB:
xml-plotter-1
- state: works
- repair log: Printing/xml-plotter-1
xml-plotter-5
- state: carousel driver needs to be replaced
- repair log: Printing/xml-plotter-5
HP ColorPro
A4 plotter
http://hpmuseum.net/display_item.php?hw=80
- state: unknown
HP 7440A
A4 plotter

This plotter works with 230v, but it needs a special power supply (0v - 10v - 20v) - info in the hp museum
- user manual: https://userequip.com/files/specs/1504/HP%207440A%20Operating.pdf
- in the HP museum: http://hpmuseum.net/display_item.php?hw=80
- status: works with a parallel port, and is currently connected with an adapter to a serial port, connected to another adapter to USB
TAXAN X-Y KPL710
A3 plotter
The plotter was given to Joak by Thomas Walskaar, we're not sure who gave it to him.
- state: works
- user guide: File:Taxan kpl710 x-y plotter.pdf
- repair log: Printing/xml-plotter-3
Dip switch settings:
1   2   3   4  5   6  7  8
OFF OFF OFF ON OFF ON ON ON
BBC Metrawatt SE-283
- repair log: Printing/xml-plotter-2
HP 7550A
A4/A3/A2 plotter, with a paper feeder!
- state: Currently not working, the carousel is missing
HPGL
Hewlett-Packard Graphics Language (HPGL) is a common plotter language that most plotters speak.
You can turn any vector file into a .hpgl file with Inkscape, which is a free software vector editing tool.
More references and links related to HPGL:
- There is a HPGL book in the studio/library!
- HP-GL Reference Guide
- http://paulbourke.net/dataformats/hpgl/
- https://www.isoplotec.co.jp/HPGL/eHPGL.htm
IN;IP0,0,4000,4000;SC0,100,0,100;
SP1;
PA0,0;
PD;
PA100,0;
PA100,100;
PA0,100;
PA0,0;
PU;
CLI
Most plotters connect to this socket on a Linux machine:
/dev/ttyUSB0
Add your user to the dialout group first:
$ useradd USERNAME dialout
Then configure how your computer and the plotter communicate, these settings should work with most plotters:
$ stty 9600 parodd parenb ixon ixoff -F /dev/ttyUSB0
Then send a file with cat:
$ cat myfile.hpgl > /dev/ttyUSB0
Chiplotle
Chiplotle is an HPGL plotter driver that implements and extends the HPGL (Hewlett-Packard Graphics Language) plotter control language. It provides direct control of your HPGL-aware hardware via a standard usb<->serial port interface. Chiplotle is also a general purpose vector drawing library with functions for creating and transforming shapes, which can then be sent directly to your HPGL plotter for printing.
Chiplotle is written and maintained by Víctor Adán and Douglas Repetto.
- Main web page: http://sites.music.columbia.edu/cmc/chiplotle/
- Documentation: https://chiplotle.readthedocs.io/en/latest/index.html
- More documentation: http://sites.music.columbia.edu/cmc/chiplotle/manual/chapters/tutorial/intro.html
Use
Connect to plotter to computer with usb.
Start the plotter.
Wait! until the plotter is fully running.
Activate the venv you made.
In Linux:
$ source FOLDERNAME/bin/activate
In Windows (using Powershell):
$ FOLDERNAME\Scripts\Activate.ps1
Now you can start chiplotle:
$ chiplotle3
It should automatically detect the plotter...
If it doesn't, you can try to turn the plotter on and off, or load paper.
Once the plotter is detected, you can send a HPGL file to plotter:
plotter.write_file('FILENAME.hpgl')
When you're done, close chiplotle with:
exit()
Install
Install pip, venv
First install pip and the virtual environment python module, if you don't have them yet.
On Linux:
$ sudo apt install python3-pip
$ sudo apt install python3-venv
On Mac and Windows:
follow the instructions at https://www.python.org/.
Make a virtual environment
On Linux and Mac:
$ python3 -m venv FOLDERNAME
For example:
$ python3 -m venv plotter-venv
On Windows:
py -m venv FOLDERNAME
For example:
$ py -m venv plotter-venv
Activate the virtual environment
On Linux and Mac:
$ source FOLDERNAME/bin/activate
On Windows (using Powershell):
FOLDERNAME\Scripts\Activate.ps1
You can exit again by writing deactivate.
Install Chiplotle
Install Chiplotle inside this virtual environment (the Python library to speak HPGL to the plotter):
$ pip install Chiplotle3
Run Chiplotle
See #Use.
Errors
Windows: Script Execution Policy
See: https://www.makeuseof.com/enable-script-execution-policy-windows-powershell/
Mac: ImportError: module not found "imp"
?
Windows: "port" not found (?)
File "C:\Users\aless\OneDrive\Desktop\PENPLOTTER_venv\lib\site-packages\serial\serialutil.py", line 268, in port
   raise ValueError('"port" must be None or a string, not {}'.format(type(port)))
ValueError: "port" must be None or a string, not <class 'int'>
Alessia and Manetta spend an hour on this error on Nov 13th 2023, but did not figure it out. There is little documentation on using Chiplotle on Windows unfortunately. A next step could be do open serialutil.py to see if the error can be resolved directly there.
It's the next day now, we looked into this again and solved it!
First, edit your Chiplotle config file, which is stored in your home folder, which you can edit on Linux/Mac with:
$ nano ~/.chiplotle/config.py
or on Windows:
> notepad C:\Users\USERNAME\.chiplotle\config.py
Change this line:
serial_port_to_plotter_map = None
into:
serial_port_to_plotter_map = {'COM4' : 'HP7475A'}
or use another plotter model number.
Secondly, you need to also edit a Python script within the Chiplotle library, which you can open on Linux/Mac with:
$ nano PATH-TO-YOUR-VENV/chiplotle3/src/chiplotle3/plotters/baseplotter.py
or on Windows:
> notepad PATH-TO-YOUR-VENV\chiplotle3\src\chiplotle3\plotters\baseplotter.py
Then edit the following on line 196:
@property
def _buffer_space(self):
    self._serial_port.flushInput()
    self._serial_port.write(self._hpgl.B().format.encode())
    bs = self._read_port()
    return int(bs)
and just change the last line:
@property
def _buffer_space(self):
    self._serial_port.flushInput()
    self._serial_port.write(self._hpgl.B().format.encode())
    bs = self._read_port()
    return int(128)
Now Chiplotle should work.
Raspberry Pi
Numpy error:
libopenblas.so.0: cannot open shared object file: No such file or directory
Install the missing library:
$ sudo apt install libopenblas-dev
Inkscape
The plot function is under: export > plot
Error: pySerial is not installed.
Please follow these steps:
- Download and extract (unzip) this file to your local harddisk: https://pypi.python.org/packages/source/p/pyserial/pyserial-2.7.tar.gz
- Copy the "serial" folder (Can be found inside the just extracted folder) into the following Inkscape folder:
/usr/???????? - Close and restart Inkscape
Make a vector file in Inkscape.
Save it as a HPGL file. See the image on the right for the settings.
For example: A3 landscape
Tip (!): landscape file = portrait plot. Make a landscape document, it plots in portrait orientation on the plotter (weird, but works)

PloViewMini
PloViewMini is a tool to visualise HPGL code digitally. It's a demo version of the not-so-mini, regularly sized PloView -- which requires a license that seems to be supported no longer (?), but would allow you for more than just plowViewing, also ploDrawing and maybe even ploMore. One can download the installer at the Isoplotec site.

Installation Guide
Download the zip file at the isoplotec website.


When running the file (on Windows), one may be prompted with a shady installation wizard. It appears it doesn't translate to Unicode characters properly, probably because the software dates back to the 80s. Forcing your OS to interpret non-Unicode characters as Japanese will reveal the true meaning.
Control Panel > Region and Language > Administrative > Language for non-Unicode programs > Change System Locale > Japanese.
- Select 同意する (agree)
- Click 次へ (next)
- For ユーザー名 (username), fill in a username (it should give a default option, which should be fine to use)
- For 組織 (organisation), fill in an organistion name (leaving it blank should be fine)
- Click 次へ (next)
- Click インストル (install)
Note that, at any point, you can click キャンセル (cancel) to cancel or 戻る (go back) to go back.
(This installation guide has been verified for Windows 10. Please append to it if your OS requires a different method.)
Pens
HP Fiber Tip Plotter Pens S Style Pens:
- $ 22 for 5: https://www.draftingsteals.com/catalog-plotters---plotter-supplies-plotter-pens-fiber-tip-plotter-pens.html
3d printable adapters for pens:
References


.jpg)

- Vera Molnár, women in early computer art (since 1940s) + Monoskop page
- New Tendencies movement, five international exhibitions in Zagreb, Croatia/Yugoslavia (1961-1973)
- Compas 68 (Dutch group around 1968/1969)
- Seymour Papert, Talking Turtle (1983)
- Mindstorms: children, computers, and powerful ideas, by Seymour Papert (1980)
- A Logo Primer, by the LOGO Foundation
- The Concept of a Metafont, by Donald Knuth published in Visible Language (1982)
- Pseudoplotter, an experimental art-zine about free non objective drawing in the spirit of Paul Klee's 'Pedagogical Sketchbook', by Marc van Elburg (2013)
- Drawing Curved, a collection of texts and images concerned with digital curvature, by Pierre Huyghebaert, Colm O'Neill with contributions by Femke Snelting (2018)
- REMAP, a hybrid sonic drawing device and interactive installation, by Signal-to-Noise (2015-2016)
- Up Pen Down research, fonts and workshops series by OSP (Oct 2017) + workshop (Oct 2015) + workshop at the ESAD Valence Grenoble (2012/2013) + publication outcome
- Hersey Text, a stroke font Inkscape extension + link + wiki or see
extensions > text > hershey text - Botopera, performance and installation by Gijs de Heij, An Mertens, Anne Laforette, Antonio Roberts, Michael Murtaugh (2015)
- Pensnake, by Joak (2022), pictures from Zinecamp 2022
I asked on the PPP chats if anyone knew any specific contexts/places where pen plotter enthusiasts meet, and the following links were send in return. Also, interestingly enough two people jokingly warned me for a recent attention shift they observed from pen plotting to nfts and AI, placing pen plotting into the field of generative art. – Manetta (talk) 13:20, 21 November 2023 (CET)
- https://bm.raphaelbastide.com/?searchterm=&searchtags=plotter+ (Raphaël Bastide's plotter bookmarks)
- https://ivan-murit.fr/
- https://mastodon.art/@thresfold@genart.social
- https://mastodon.design/@rmfrt
- https://twitter.com/Julien_Espagnon
- https://genart.social/@mwebster
- http://v3ga.art/
Tools/tutorials/techniques
- Upgrade for your DIY plotters: cross hatching
- Cross hatching in Processing
- Color layering with Ghostscript, Gimp & Inkscape
this pen plotter is (not) made to die
Printing repair sessions wiki page, initiated by Joak in 2023
Monday 30 + Tuesday 31 Oct 2023
Joak: On Monday (30/10/2023) and Tuesday (31/10/2023) I will be helping to repair the pen plotters between 5:15pm and 7:30pm. You have probably seen all the different (broken) pen plotters in the XML or Studio, these come from WDKA and other places. Most of them need probably just a small fix, some have a complex problem. These two evenings are just a start. I think by the end of this term 3/4 of the pen plotters should be working again.
If you are interested, just pass by. No previous knowledge of electronics, programming or pen plotters are required. These repair evenings are intended as an introduction to these topics. Everyone is welcome. Modus operandi: You will get an pen plotter on your table and step by step you will repair it over the next weeks or you will even modify it and do some imaginary (but still real) drawing tool/device.
Location: aquarium or studio
The plan is to do in the second trimester the same with (electronic) typewriters and in the third trimester with dot-matrix-printer!
The DB9 to DB25 adapters were soldered. You can get the PCB files here: https://git.xpub.nl/XPUB/adapter
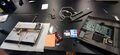
Plotters were opened, cleaned and inspected.
A broken part (the so called "Geneva Drive Wheel mechanism") was 3d printed for Printing/xml-plotter-1, a flipping part that let's the pen carousel rotate: https://www.thingiverse.com/thing:4696713 + https://www.youtube.com/watch?v=G5_YltaYZsg
this pen plotter is (not) made to die

the 3d printer Geneva Drive Wheel mechanism

Plotter adapter
_made_to_die.jpg)


Monday 13 + Tuesday 14 November
Victor and Joak looked into the alignment issue of HP 7475A, maybe its really a mechanical issue. It was solved?
Alessia, Thijs, Joak and Manetta worked on the TAXAN_X-Y_KPL710, see the repair log here: Printing/xml-plotter-3.
Monday 27 November
Plotter (pre-)party!!! 🎉
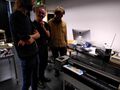
Pen plot party at the studio
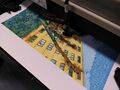
Pen plot experiments by Victor & Thijs, using the processing script to make halftone rasters in CMYK


Monday 6 February

exciting news everyone: To kick of the new plotting-year there will be a Pen-Plotter Party on Monday feb 12. Save the date, and get ready for the launch of the Plotting table, Plotting zine alongside various plotting-activities. Do you want to contribute to this event? either contact @Thijs or @Victor on Zulip and join the pen-plotting-commitee!! 🖋
https://hub.xpub.nl/chopchop/PEN-PLOTTING-PARTY/
Prototypes, tryouts, projects, gallery
drawing horses and shoebils zine by Victor?
Plotting volume levels

At Machinecamp, an event accompanying zinecamp, Victor and Thijs gave mini penplotter workshops to visitors. During the event, they wrote some javascript code to capture ~2 minutes of audio and translate the volume levels to HPGL. This was then sent to a plotter.
It is available with a web interface as part of the SI23 quilt.
The code can also be found at the dedicated wiki page.
Crosshatching experiments
Inspired by https://hackaday.io/project/20585-upgrade-for-your-diy-plotters, Victor and Thijs wanted to do some crosshatched plots. They wrote a processing script to convert images to crosshatched versions. By doing this for an image's different CMYK color channels separately, it is possible to create intricate multicolor plots.
A workflow for this technique can be found here: here


pen plot mazes by Alessia and Thijs?
Twitch Plays Plotter
twitchplaysplotter is a project inspired by TwitchPlaysPokemon in which a pen plotter can be controlled through the chat of a Twitch livestream. This project, worked on by Rosa, Victor and Thijs, was initiated both to experiment with the collaborative and performative nature of plotters, and to facililate participation of pen plotter enthusiasts who were not able to make it to the 2024-02-12 pen plotting party physically.
- A Git repository containing the project can be found here
- The twitch channel can be found here
- A dedicated project page can be found here
Vertical alignment tools
(@Thijs shall we add them here?)
Universal pen holders
(@Thijs shall we add them here?)
What does it mean to perform?
A rapid prototype by User:Ssstephen
As well as making connections I want to examine ones that are already there, and examine my own practices as they exists generally.
Simultaneous and consecutive interpreting: what are you doing here stephen? Documenting old and new things that I am doing and how they connect.
What does it mean to perform?
per-
word-forming element common in words of French and Latin origin, meaning primarily "through," thus also "throughout; thoroughly; entirely, utterly," from Latin preposition per (see per (prep)).
The verb was used with wider senses in Middle English than now, including "to make, construct; produce, bring about;" also "come true" (of dreams), and to performen muche time was "to live long." Related: Performed; performing; performable.
How can a performance be open in the same way as an object can, to refuse to be finished?
now I try to connect the pen plotter to marcus
today I think I will learn how to use debian some more.
What is the difference between "su" and "su -"? Something to do with $PATH. Something to do with directories.
Its a little confusing switching between two laptops. The manual for DraftPro DXL plotter reminds us to use the hpgl IN command.
And first the tty needs to be configured: "9600 baud, no parity, 8 data bits, one stop bit, and continuous error checking." on page 7-7 of the manual.
stty 9600 parodd parenb ixon ixoff -F /dev/ttyUSB0
Then you can send it hpgl files or directly send commands with echo.
cat file.hpgl > /dev/ttyUSB0
echo "IN; SP1; PU0,0;PD0,100;PA100,0;SP0;" > /dev/ttyUSB0
Also its not important for the cv2hpgl module, but I want to test sending text to the plotter.
I'm using chiplotle now again and I think it might be helping with buffering, not sure.
chiplotle> plotter.write_file('myfile.hpgl')
So editing the hpgl file and running this from another terminal window (in the venv).
I think I will switch to using a python script with chiplotle imported into it. then the python script can take inputs from the esp and send them back out the other side as hpgl.
Plot device
A rapid prototype by User:Ssstephen
plot device
Ok I forgot about this since the 4th october. Today I want to pick up where I left off and:
- Next I want to add the second input and maybe the gate input too.
- Its not in real time which is sad. So maybe fix this or maybe find a system that takes it into account (record and print on trigger for example).
First I'll try to make it work from before again so I have to remember for a minute. Actually for like half a day but Manetta helped, I was running the wrong arduino sketch.
The second input wasn't too hard to add. And I'm using a different plotter, I'd like a better solution for scaling the voltage output to the page size. Maybe chiplotle will let me read the document size and I can adjust according to that. Also the CV output of the synth is too big (10V I think, I cant remember. Also how does DC offset work in this case I guess the centre of the signal should be the center of the page) so it would be nice to attenuate that analog signal before it gets measured by the ESP32.
I get so many encoding errors why. Ok less now because I did try except in python. But for some reason the data for the button wont write to the variable in python why. why was this world created. why are any of us still here.
The signal is really noisey it's pretty cool though.
I wonder what the sample rate is.
I'd like to get the button working, first as a trigger and then as a gate. Then connect a jack input to use CV also.
Then I think I can play with it more, pretty soon.
rodent trace ornamentation
A rapid prototype by User:Ssstephen
rodent trace ornamentation
a few weeks ago i made a script that saves my mouse actions to a text file. and by made I mean i pressed, among other buttons, ctrl+c and ctrl+v.
from pynput.mouse import Listener
import logging

logging.basicConfig(filename="mouse_log.txt", level=logging.DEBUG, format='%(asctime)s: %(message)s')

def on_move(x, y):
    logging.info("Mouse moved to ({0}, {1})".format(x, y))

def on_click(x, y, button, pressed):
    if pressed:
        logging.info('Mouse clicked at ({0}, {1}) with {2}'.format(x, y, button))

def on_scroll(x, y, dx, dy):
    logging.info('Mouse scrolled at ({0}, {1})({2}, {3})'.format(x, y, dx, dy))

with Listener(on_move=on_move, on_click=on_click, on_scroll=on_scroll) as listener:
    listener.join()
today I want to send that data to the plotter instead in a language it understands. i want to do this as a way of ornamenting and documenting the work that happens through the mouse or trackpad. pen plotters are often used for presentations: it is about finding what is between the past and the future. i want to try not to focus on the cartesian coordinates in the data but they might be useful. the data looks kind of like this:
2023-10-25 12:17:36,329: Mouse moved to (1816, 799)
2023-10-25 12:17:36,337: Mouse moved to (1814, 799)
2023-10-25 12:17:36,345: Mouse moved to (1812, 799)
2023-10-25 12:17:36,353: Mouse moved to (1809, 800)
2023-10-25 12:17:36,361: Mouse moved to (1807, 801)
2023-10-25 12:17:36,369: Mouse moved to (1805, 801)
2023-10-25 12:17:36,376: Mouse moved to (1803, 801)
2023-10-25 12:17:36,385: Mouse moved to (1800, 801)
2023-10-25 12:17:36,393: Mouse moved to (1799, 801)
2023-10-25 12:17:36,401: Mouse moved to (1798, 801)
2023-10-25 12:17:36,553: Mouse clicked at (1798, 801) with Button.left
2023-10-25 12:17:36,729: Mouse clicked at (1798, 801) with Button.left
2023-10-25 12:17:37,440: Mouse moved to (1798, 801)
2023-10-25 12:17:37,953: Mouse scrolled at (1798, 801)(0, -1)
2023-10-25 12:17:37,969: Mouse scrolled at (1798, 801)(0, -1)
2023-10-25 12:17:37,977: Mouse scrolled at (1798, 801)(0, -1)
2023-10-25 12:17:37,993: Mouse scrolled at (1798, 801)(0, -1)
2023-10-25 12:17:38,009: Mouse scrolled at (1798, 801)(0, -1)
2023-10-25 12:17:38,033: Mouse scrolled at (1798, 801)(0, -1)
2023-10-25 12:17:38,040: Mouse scrolled at (1798, 801)(0, -1)
2023-10-25 12:17:38,057: Mouse scrolled at (1798, 801)(0, -1)
2023-10-25 12:17:38,065: Mouse scrolled at (1798, 801)(0, -1)

set lost to true
the data being collected in the script that i can see:
- something happened (listener)
- it happened now (asctime)
- by something, it was either a click, move or scroll
- it happened somewhere xy (this is presented as if it's two pieces of information, weird)
- if it was a click, it involved a particular button (strange my trackpad does not have buttons)
- if it was a scroll it moved to another relative position dxdy#
how to track and dance with the work done by the rodent? how long has it been since you last did something? the longer its been, the further you move. the direction isnt important yet.
Its working. the longer I take to move the mouse, the longer the line becomes. the script is like this:
# It sends your mouse data to the pen plotter to see
# what you're up to over there.

from chiplotle3 import *
import math
import random
import time

from pynput.mouse import Listener
import logging

# initialise chiplotle
plotter = instantiate_plotters( )[0]

t0 = 0
t1 = 0
dt = 0
x = 0
y = 0
notplotting = 1
eventwaiting = 0
button = "0"
coords = []

plotter.select_pen(1)
plotter.write(hpgl.PU([(0,0)]))

print("init done")

def on_move(x, y, button="Left", pressed="1"):
    #logging.info("Mouse moved to ({0}, {1})".format(x, y))
    global t0
    global t1
    global dt
    global notplotting
    t0 = t1
    t1 = time.time()
    dt = (t1-t0)*1000
    print("new move length is " +str(dt))
    if dt > 3000:
	    plotnow(dt)

def plotnow(dt):
	print("plottin now")
	dx = int(dt/100)
	plotter.write(hpgl.PU([(0,0)]))
	plotter.write(hpgl.PD([(-dt,7000)]))
	time.sleep(0.1)

with Listener(on_move=on_move, on_click=on_move, on_scroll=on_move) as listener:
    listener.join()

plotting and doubting irrationally
so in summary the script gives bigger gestures the less work is done by the rodent (the longer the times between gestures on the trackpad). It is a celebratory performance of laziness. It encourages working less. It measures the opposite of time and translates it to vectors. There is an inverse relationship between busy-ness/business and the intensity of the performed gestures.
to do: should the hpgl commands be relative instead of absolute? it would be more lost then which would be nice. Its something to do with gregory bateson and christopher small and taylorism and Frank and Lillian Gilbreth. Joseph says talk to steve rushton about it. is the language getting too abstract or is that the point?
https://zetabooks.com/wp-content/uploads/introSP22.pdf
Plotters at XPUB (wiki-zine, version Nov/23)
A5 booklet that was printed to celebrate the plotter party on Monday 27 November at the XPUB studio.
It's a printed version of this wiki page, made with User:Manetta/Booklet.sh.
The PDF can be found here, and a booklet version here.
is there more? :)
Pen plot memes


