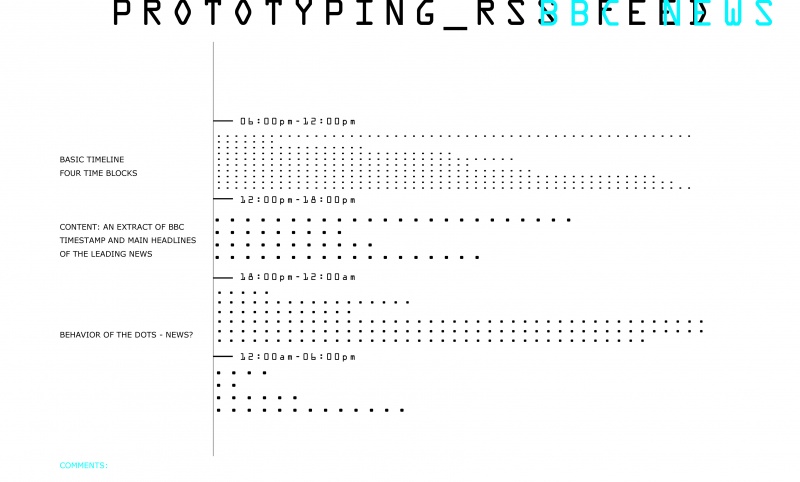
API/RSS 1.1
field of interest:
How dense are the news? How news could be visually presented as a single unit?
I am using RSS from BBC News(for now) as a source. I want to built simple map of time and content.
When the news is published online and what is the main subject matter?
br>
( Are the news feed relevant or accurate to the current time of the event
or they have been driven by "right" time to be broadcasted)
outcome:
to combine, recombine and compare different sources
highlight certain concentration, density and flow of the data.
notes on real data visualization :
* timeline consists of four time swats, where the news headlines will be displayed, embedded as links.
* simple visual id - each news represented as a data point - equal by its layout different by its content.
* behavior of the single point - need to be consider and develop furthermore?how?
I am using jQuery plugin (Cross-domain RSS to JSON converter), which requests feed from different world news then the script converts the JSON object into javascript. The data (svg) is been sorted by time - the hour of being published and placed into simple timeline.
src: http://pzwart3.wdka.hro.nl/~mlakova/news_rss/

code:
function drawTimelineFeeds(newsFeedId){
var url = ""; if(newsFeedId==1){
url= 'http://feeds.bbci.co.uk/news/world/rss.xml';
} else if(newsFeedId==2){
url= 'http://rss.cnn.com/rss/edition_world';
} else if(newsFeedId==3){
url= 'http://www.worldcrunch.com/rss/';
}
//
$.jGFeed(url,
 function(feeds){

   if(!feeds){

     return false;
   }
 var i =  0;
 var y = 0;
 var svg = document.getElementById ("svg");
   for(var i=0; i<feeds.entries.length; i++){
     var entry = feeds.entries[i];
     var a = document.createElementNS("http://www.w3.org/2000/svg","a");
     var line = document.createElementNS("http://www.w3.org/2000/svg","line");
a.setAttributeNS("http://www.w3.org/1999/xlink", "href", entry.link);
var pubDate = entry.publishedDate;
var d = new Date(pubDate);
var hours = d.getHours(); //hours
var minutes = d.getMinutes();
var w = 1400;
var x = hours*(w/24);
var x1 = minutes*(w/1440);
var barwidth = 25.5;
     if(newsFeedId==1){
       line.setAttribute('x1', x);
       line.setAttribute('y1',x1);
       line.setAttribute('x2', x+barwidth);
        line.setAttribute('y2', x1);
       line.setAttribute("style","stroke: black; stroke-width: 4;");
       y+= 10;
     }
     else if(newsFeedId==2){
       line.setAttribute('x1', x);
       line.setAttribute('y1',x1+100);
       line.setAttribute('x2', x+barwidth);
        line.setAttribute('y2', x1+100);
       line.setAttribute("style","stroke:red; stroke-width: 2;");
       y+= 5;
     }
     else if(newsFeedId==3){
        line.setAttribute('x1', x);
       line.setAttribute('y1',x1+200);
       line.setAttribute('x2', x+barwidth);
        line.setAttribute('y2', x1+200);
      line.setAttribute("style","stroke: grey; stroke-width: 5;");
       y+= 5;
     }

        a.appendChild(line);
        svg.appendChild(a);
      }
    }, 400);
}
$(document).ready(drawTimelineFeeds(1));
$(document).ready(drawTimelineFeeds(2));
$(document).ready(drawTimelineFeeds(3));
open for proposals or how the prototype could be moved a step further pls write your comments here:
