User:Simon/Special Issue 8/The Network we (de)Served
The Network we (de)Served, Part 1: Mapping network topologies
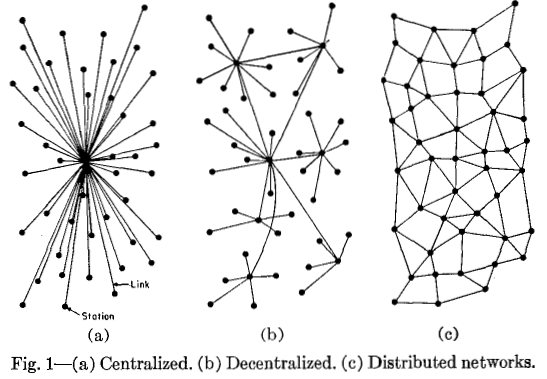
paul baran diagrams
We started with a reading of a text on centralised, decentralised, and distributed networks that included a diagram made by Paul Baran for the RAND corporation. This diagram displays classic ways to visualise these networks.
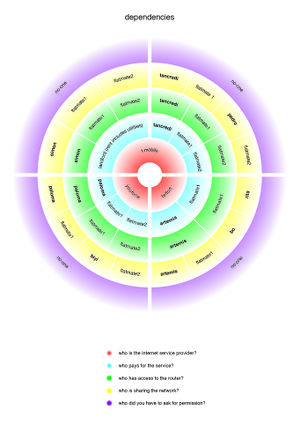
dependency mapping task
As part of the Infrastuctour, when we set up our homeservers, I worked with Artemis to create a visualisation of the dependencies involved setting them up.
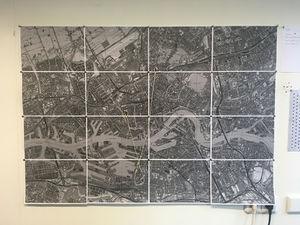
physical map in XPUB studio
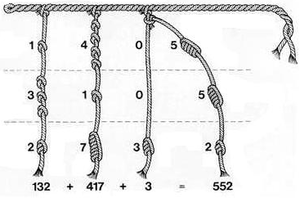
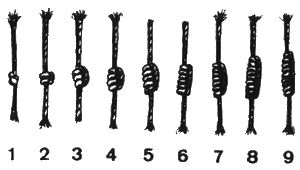
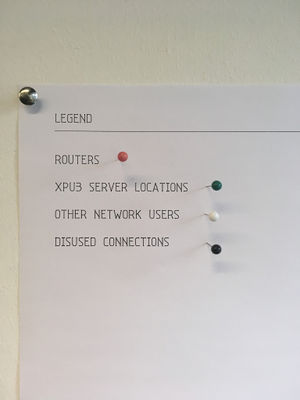
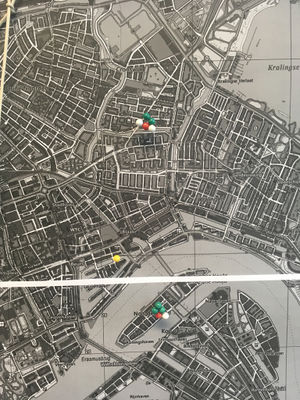
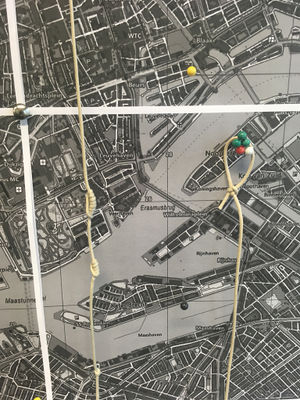
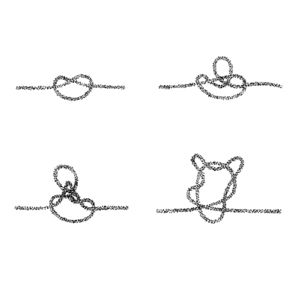
I made a map of the location of homeservers and routers, including the other (non-XPUB) network users as well as situations where it was not possible for XPUB students to connect their server to their home router, and so had to depend on others. Manetta introduced me to Inca Quipu, a way that the Inca recorded numbers by tying knots in strings.
I connected a piece of string I'd tied knots in to represent my external IP address for my home server, as a way to visualise the idea of connecting and also the route that a client follows when connecting to my website, which is in reverse from the way I would display my IP.
collection of texts
I began collecting relevant texts to my research and creating html pages to store them on my website. This has been a useful way to develop my web design knowledge and skills as well as provide theoretical basis for the research I'm undertaking into network topologies.
Tung-Hui Hu: Truckstops on the Information Superhighway
https://issue.xpub.nl/08/Research/b-e-e-t.r-o-o-t.net/truckstops_on_the_information_superhighway.html
Paul Rand: Cybernetic Guerilla Warfare (Radical Software 1.3)
https://issue.xpub.nl/08/Research/b-e-e-t.r-o-o-t.net/cybernetic_guerilla_warfare.html
R. Buckminster Fuller: Software (Radical Software 1.1)
https://issue.xpub.nl/08/Research/b-e-e-t.r-o-o-t.net/buckminster_fuller_software.html
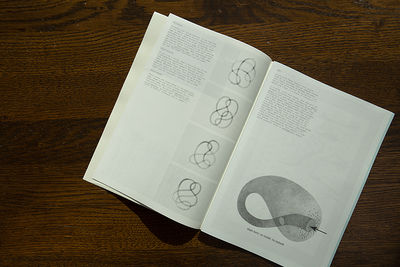
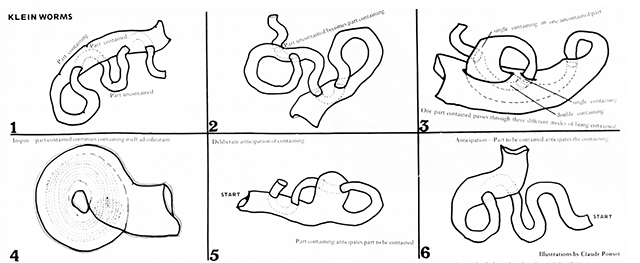
These texts introduced me to alternative models for mapping topologies such as "klein worms", referred to in both Hui (2015) and Rand's (1970) texts. Klien worms are based on the klein bottle, which falls into the category of "topologically impossible" objects (such as moebius strips etc.).
Paranodal activity
The concept of paranode (as suggested in Constant's Feminist Server Manifesto, and further explored by Zach Blas) was intriguing, and I resolved to keep this in mind when mapping network topologies. I see the paranode as both a disruptive concept (the thing that isn't there?), also not related to physical devices (established as nodes, but instead on social and conceptual relations between people and the world). I took initial references from the SI concept of the derive as a way to rethink autonomy in public space.
On further reading I found this article:
http://www.christydena.com/2007/08/new-network-theory-the-tyranny-of-nodes/
The author defines the paranodal in this way: the space between nodes; the space that is not dead, but very much alive.
The author also uses Ranciere's terminology, saying: the paranodal is "the part of those who have no part", where we experience what it is to be outside of the network while still being related to it.
maps and autonomy
I began recording some of my thoughts around the concept of contingent autonomy and how it relates to mapping. These refer to the map/territory problem, which sees a 1:1 map as redundant (and therefore useless) and also Hakim Bey's Temporary Autonomous Zone concept (introduced to me by Tancre), where the 1:1 map is the only possible way for someone to have autonomy.
https://pad.xpub.nl/p/map_thoughts
The Network we (de)Served, Part 2: Visualising network topologies
topology and graphology
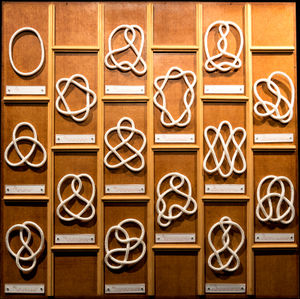
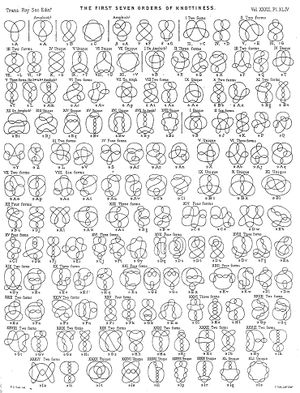
Early references explored knot theory, a study in mathematics which takes knots as topological forms. I found these interesting as alternative models of topology to the one presented by Baran; also as Roel pointed out, the etymology of the word "node" comes from the word for "knot".
Michael introduced me to Jacqueline de Jong's Situationist Times, which I found interesting (particularly Issue 3: Topology).
My research led me to discover the famous Seven Bridges of Königsberg (now Kaliningrad, Russia) problem, which prefigured topology and laid foundations for graphology (a graphic mapping of topologies). The problem asked how to devise a walk across these bridges, crossing each one only once. This was answered as impossible by Euler, who also demonstrated how the physical landscape could easily be abstracted into a graph.
Seven Bridges of Konigsberg
I also began to draw examples of network topologies based on the form of knots that I had explored with making of the physical map. I was interested in how the knots could represent physical, linear movements of data, but when in silhouette, resembled representations of distributed networks.
modularity
I began to make small sculptural models of theoretical network topologies out of polymer clay, which resembled mathematical knots.
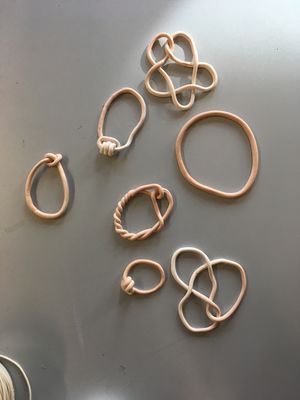
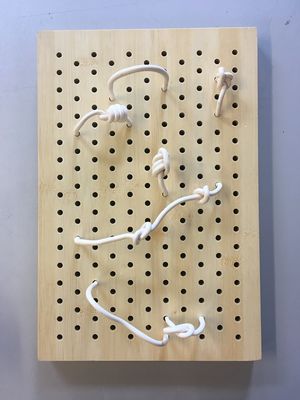
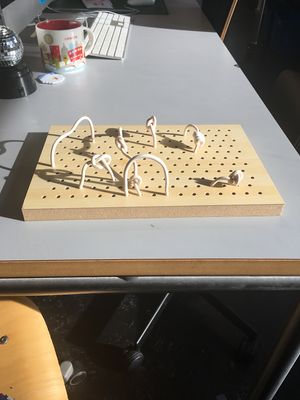
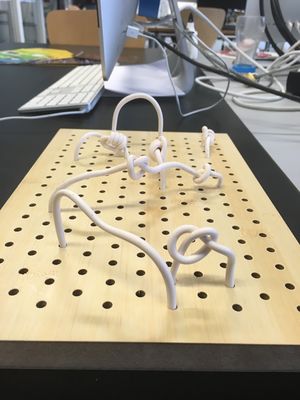
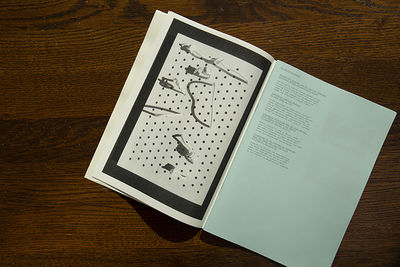
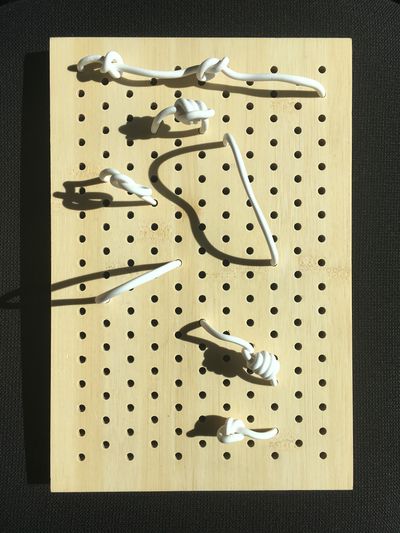
These developed into a model which incorporated a wooden board with regular holes drilled in it, kind of a static interface that these loops and knots could be inserted into, in a similar way to a modular synthesiser. This was partly inspired by a session in which artist Aditya Mandayam demonstrated use of the Plumbutter2, a modular synthesiser that comes with a manifesto and also represents a "map of Baltimore".
network of possibilities
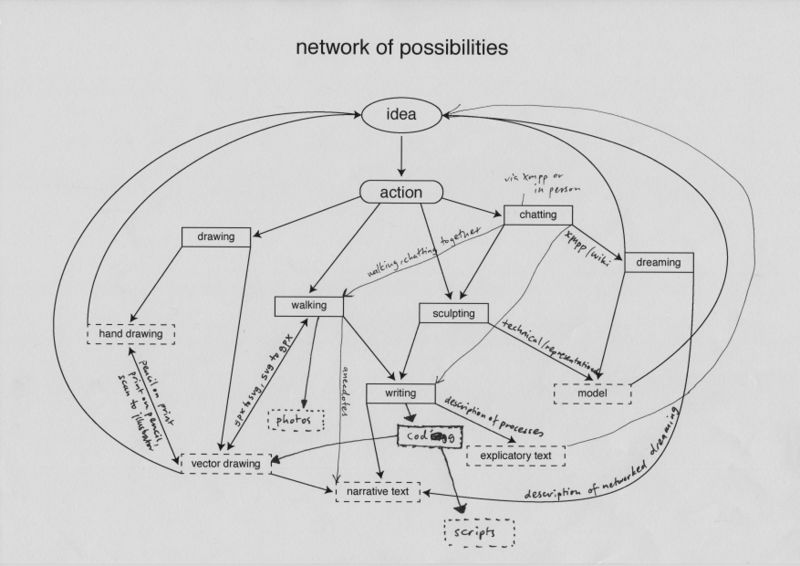
I began the second half of the trimester by determining a networked methodology for producing outcomes. The aim was to develop a heuristic; a technique which would help me understand networks better through a looped system of ideas, actions and outcomes.
gps walking
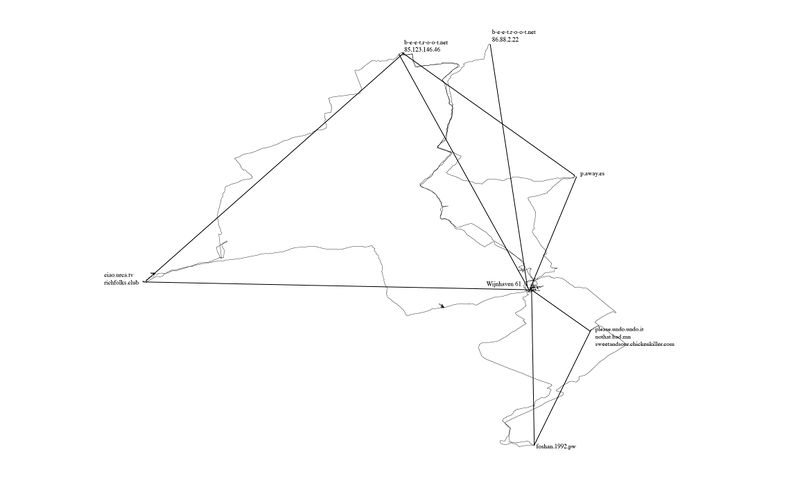
One of the actions I included in my network of possibilities was to begin walking between different points in our network (our homeservers, and also the PZI building where we gathered to have classes and work on Special Issue 08).
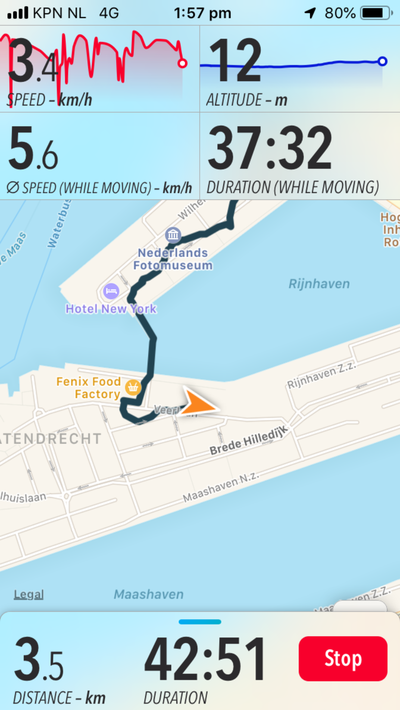
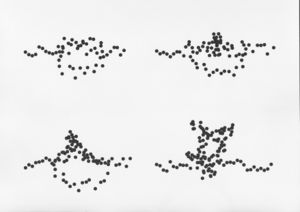
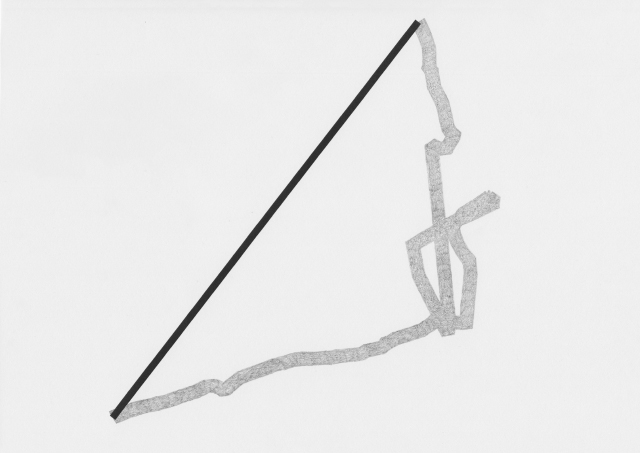
I used a hiking app called "Trails", which would record my walk over GPS, from which I could export the .gpx file generated after walking, and then load it into a program for geospatial information called QGIS. An interesting feature of this software is in how it represents the line created by walking - you can upload it as trackpoints (snapshots of your location determined by satellite trilateration), and also as straight lines between the trackpoints. I started to realise how abstraction was a large part of mapping, which reminded me of the map/territory problem.
I began to make drawings, which, by being devoid of text that would explain them, could act as illustrations of how this map was being made:
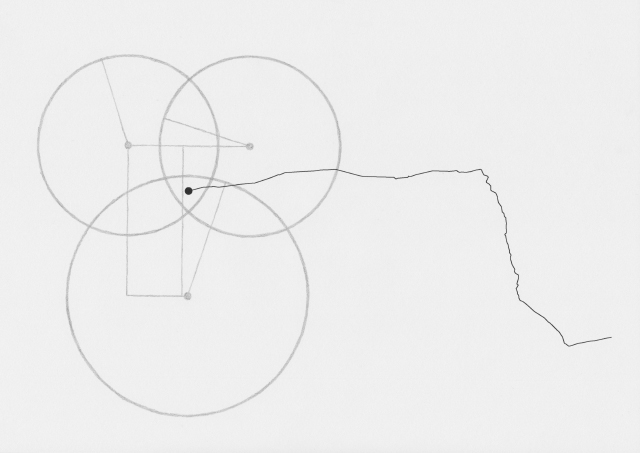
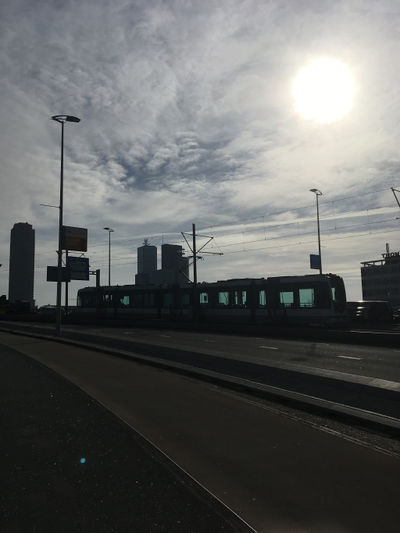
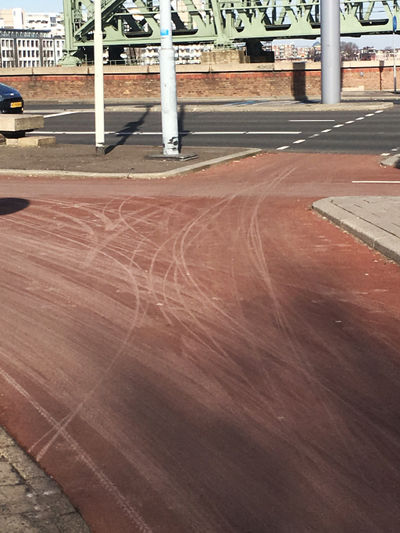
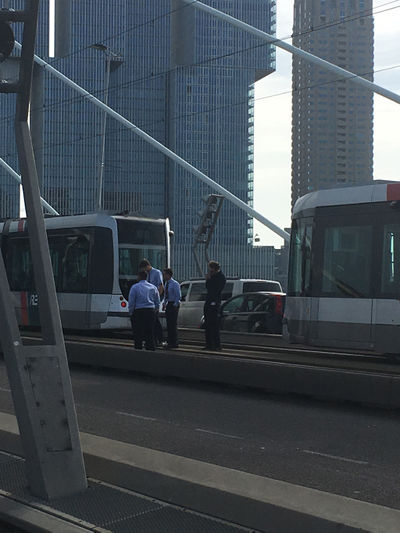
During each walk I would take photos and write notes on thoughts that came up. I began noticing other networks around me.
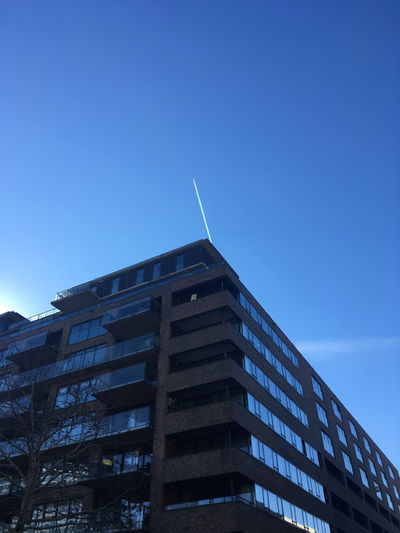
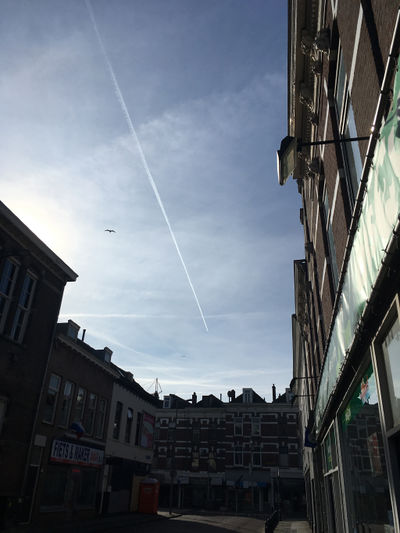
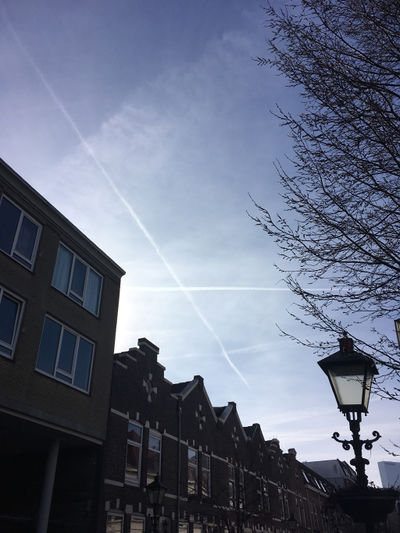
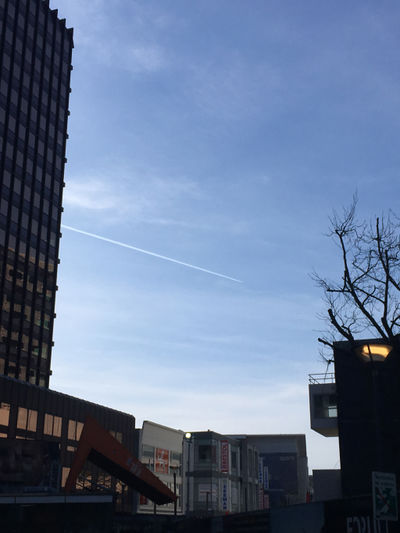
Flight paths that produced contrails (or chemtrails):
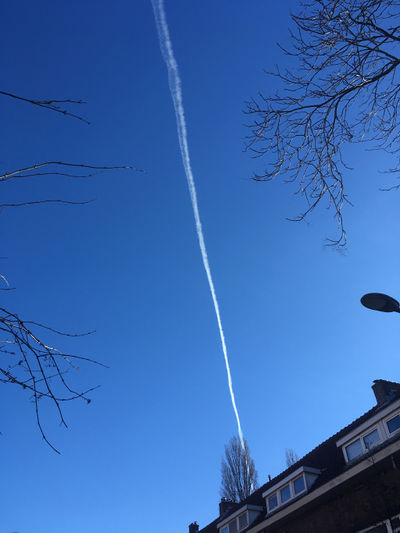
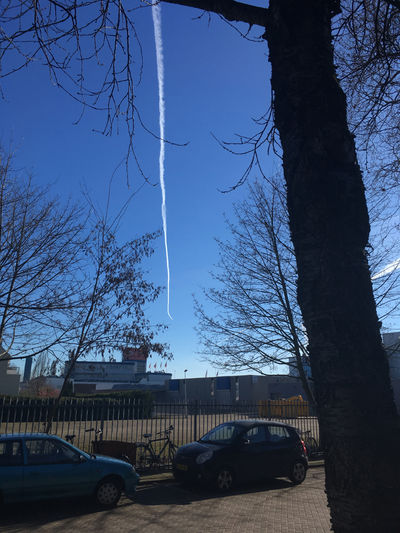
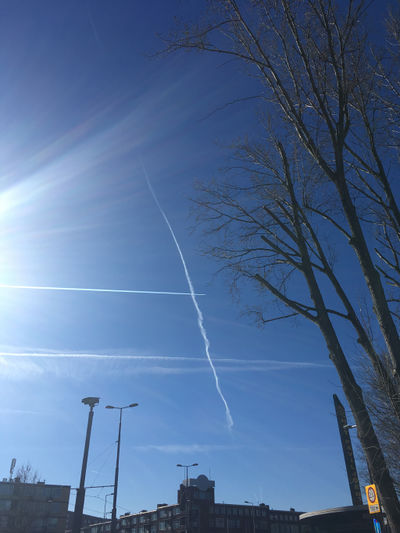
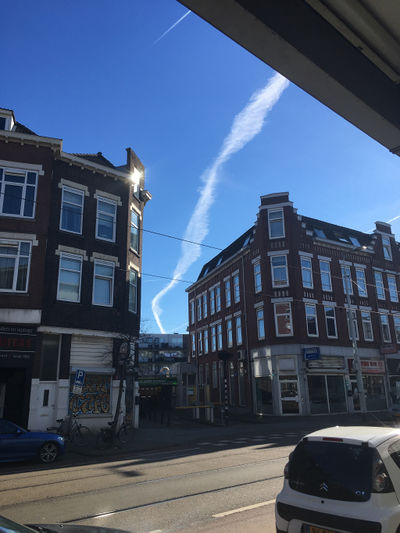
Bicycle networks:
Each walk became an act of drawing (using GPS) and also a meditation.
networked research
I also began to write down my thoughts on various topics that came up, compiling a list of the terms I was beginning to define through my research in relation to a mappable experience of the network.
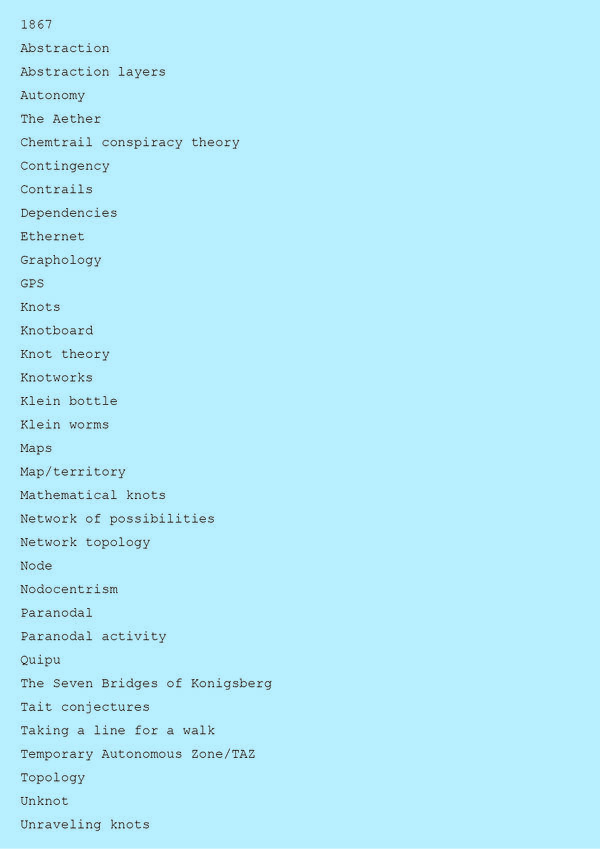
https://pad.xpub.nl/p/networked_research
As I wanted a fairly horizontal structure to my research, I decided to base the content for each page of my website on a walk.
drawing visualisations
Drawing (by hand and using vectors) became a large part of the outcomes I produced as part of my research. The drawings often shifted between "hand-drawn" and "computer-drawn", for example, I would use a .svg file made from one of my GPS walks in a vector graphics program, then print it and hand-draw with pencil over the top.
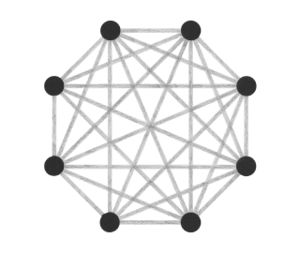
Abstraction became a key interest, and I started to think more about how these different ways of visualising all employed some level of abstraction in order to communicate. This brought me back to the typical idea of displaying network topology, as nodes and straight lines:
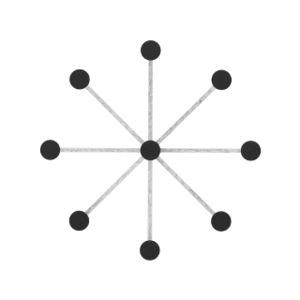
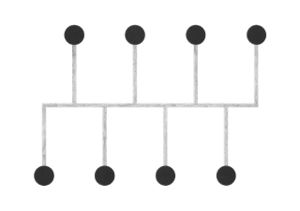
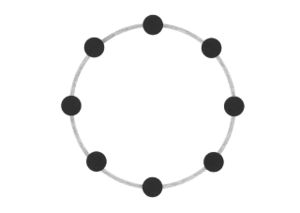
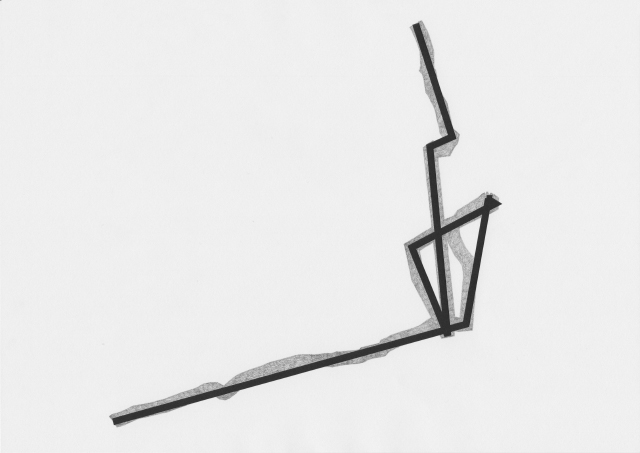
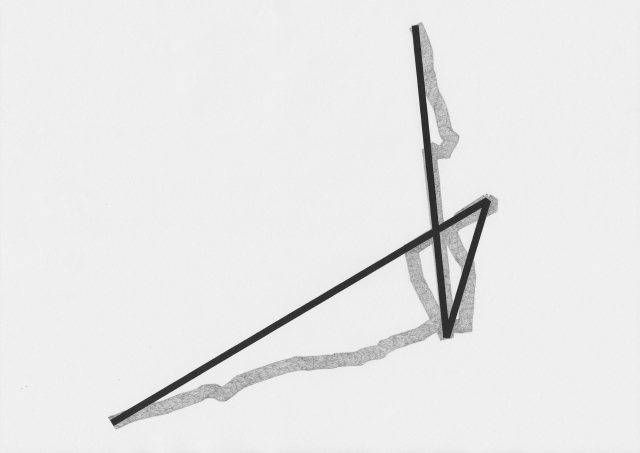
The drawings I made while GPS walking employed straight lines between trackpoints. However, this was just an abstraction - there are no straight lines in reality. In fact, the more accurately I would be able to map the network, the less useful it would be as a readily comprehensible visualisation. I also noticed that at points the GPS signal had become confused or obscured - this happened when I went into buildings (such as a cafe to buy a coffee) or when the signal might have been obscured by tall buildings around me. This produced knots, which I saw as analogous to nodes.
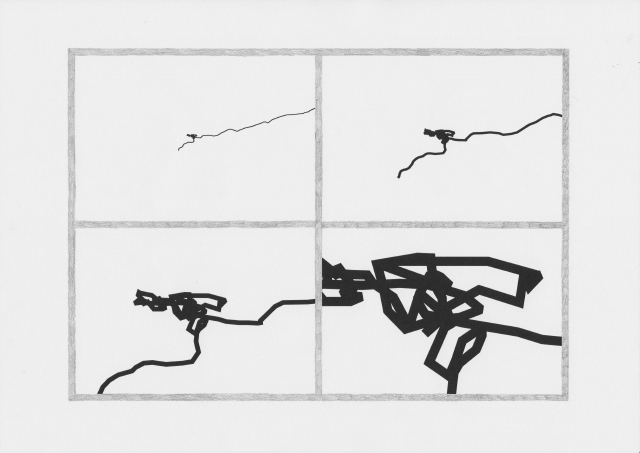
When I imported the lines I made by GPS walking into .svg format, I experimented with unraveling some of these knots, and then drew this process.
The Network we (de)Served, Part 3: From Networks to Knotworks
Early on in my research into network topologies I discovered the klein form, a "non-orientable surface".
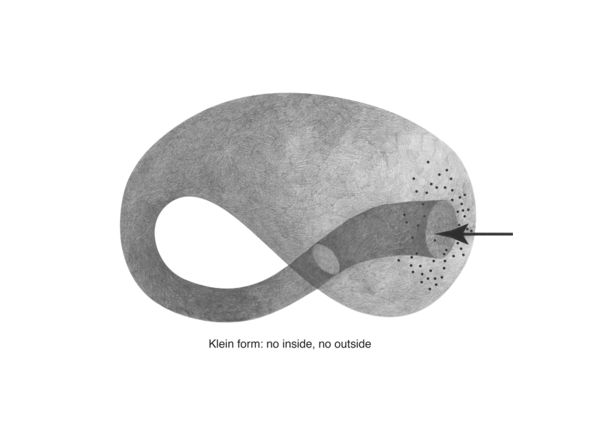
Klein forms are the basis for the "topologically impossible" klein worms. I first came across these in the first half of the trimester as illustrations in the article "Cybernetic Guerilla Warfare" from the media art newsletter Radical Software:

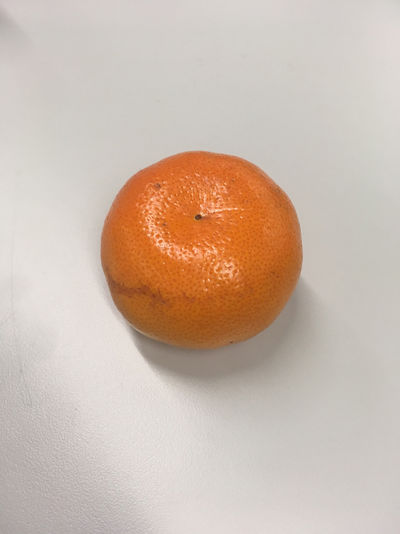
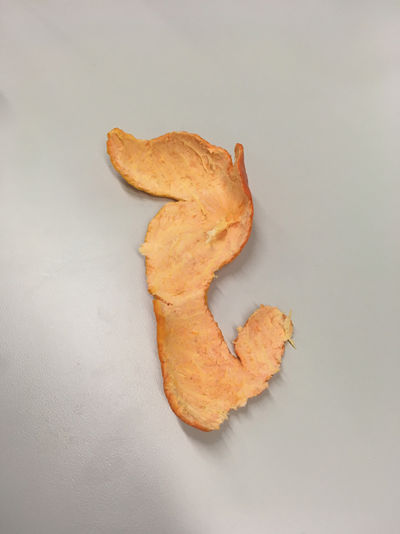
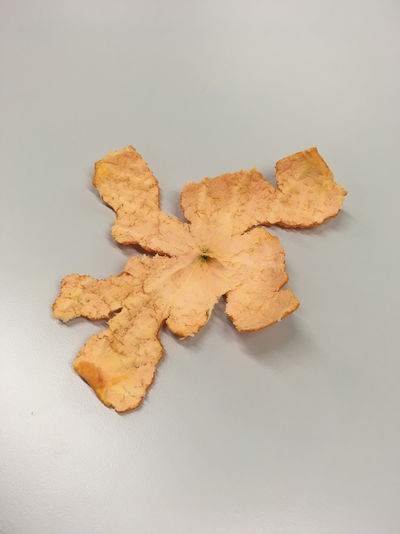
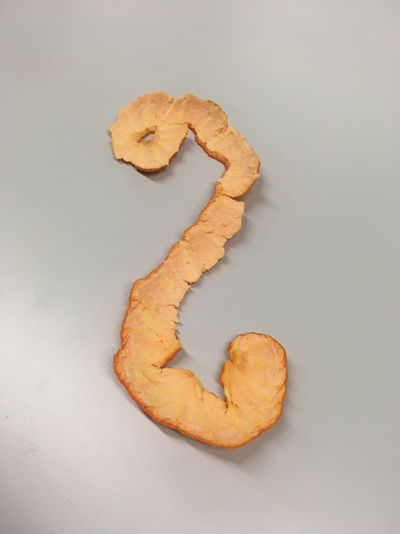
The networked methodology I was working with included shifting between different outcomes and actions. This made me think of also a shift between two-dimensional and three-dimensional forms, and thinking about how these could be "unfolded":
The knotboard I had made in the first half of the trimester proved a useful tool for thinking with my hands. I noticed that as a physical object, it was different from my drawings as it immediately had depth, and form, and as a result was affected by light, particularly shadows:
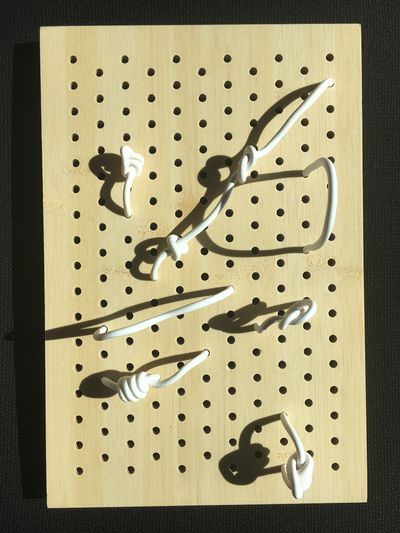
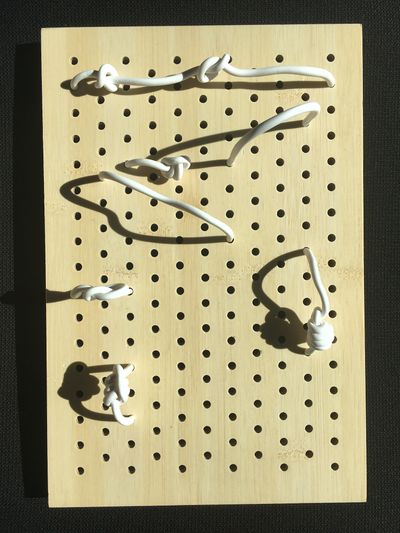
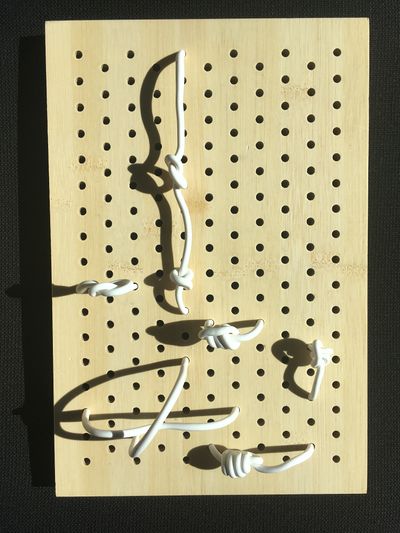
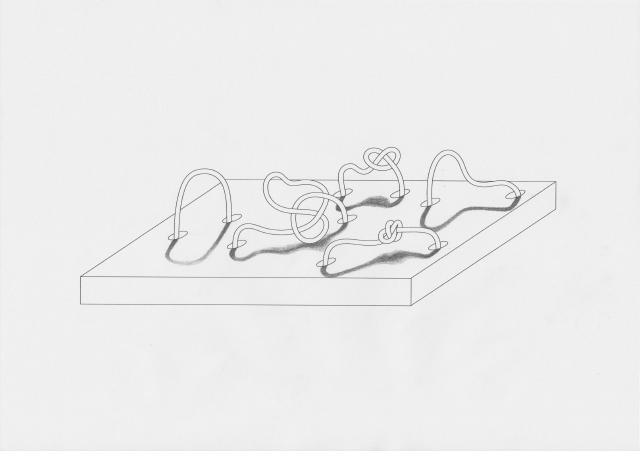
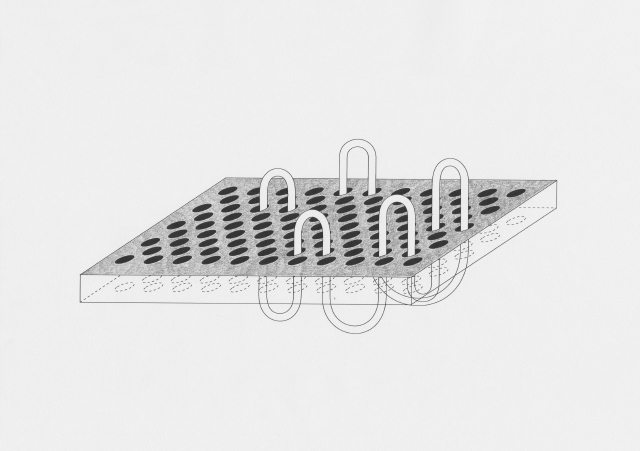
When configured in different ways (especially as a three-dimensional form) the knotboard took on a different presence. I made drawings from this, incorporating light and shadow as well as alternative ways of imagining the three-dimensional space the knotted links occupied:
Research into knot theory (a field of mathematics which studies the topology of knots) led me to discovering mathematical knots, which are different from the usual idea of a knot. I had previously explored knots as ways to record numbers (a notable reference being Quipu from ancient Andean cultures):
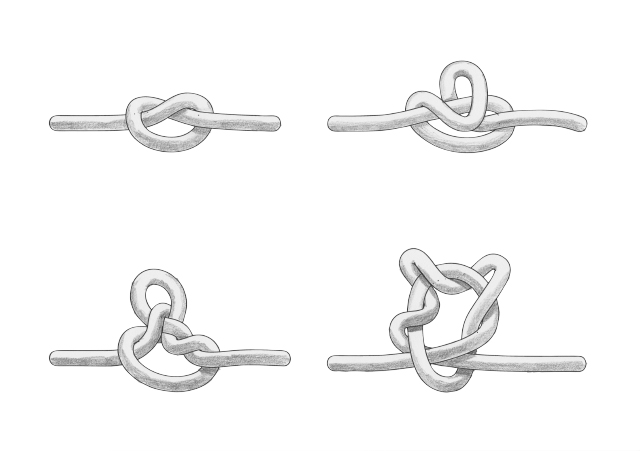
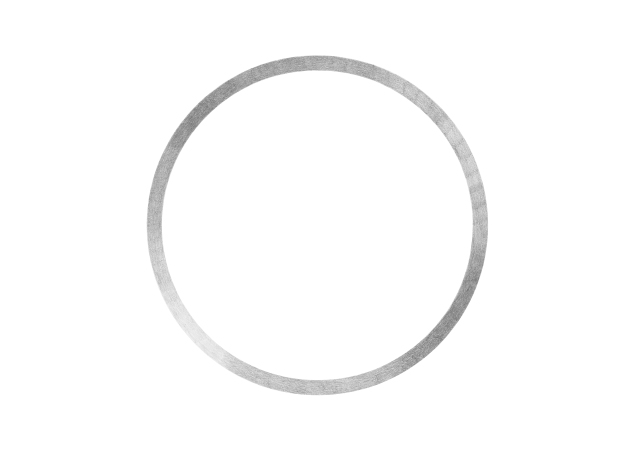
Mathematical knots are different, in that they are based on the embedding of a circle into three-dimensional Euclidean geometry R3. As such, they resemble closed loops. The first of these is the "unknot":
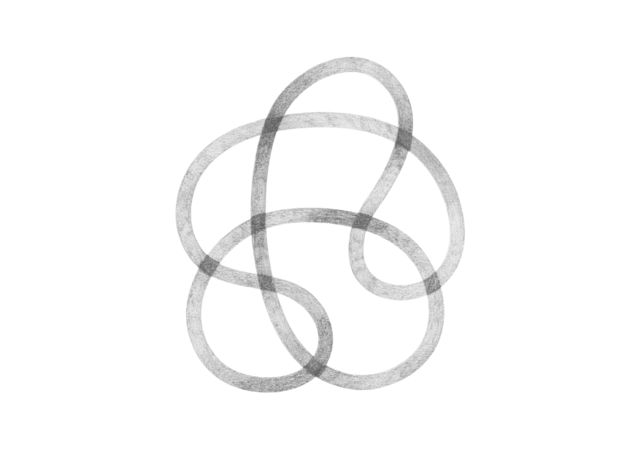
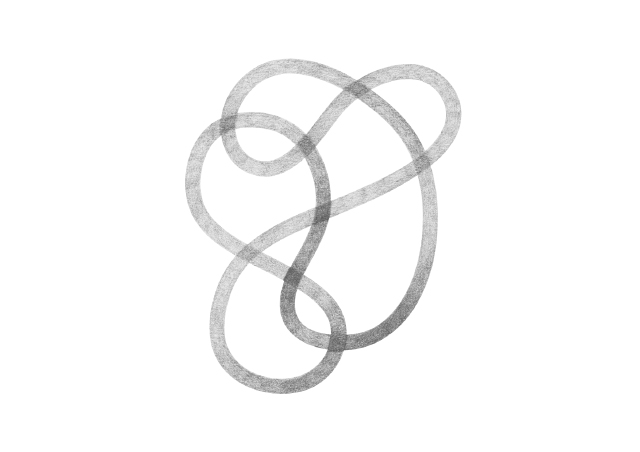
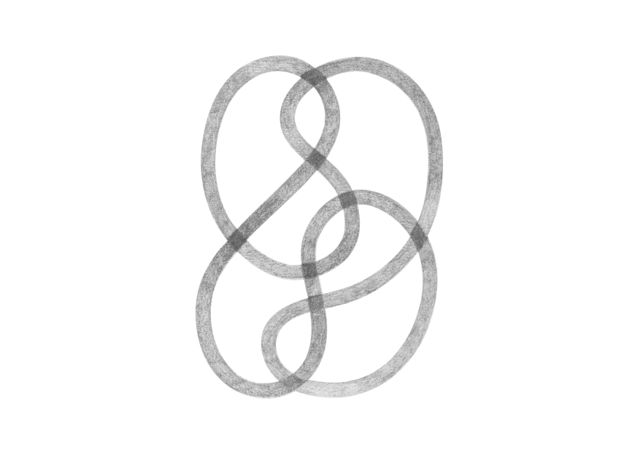
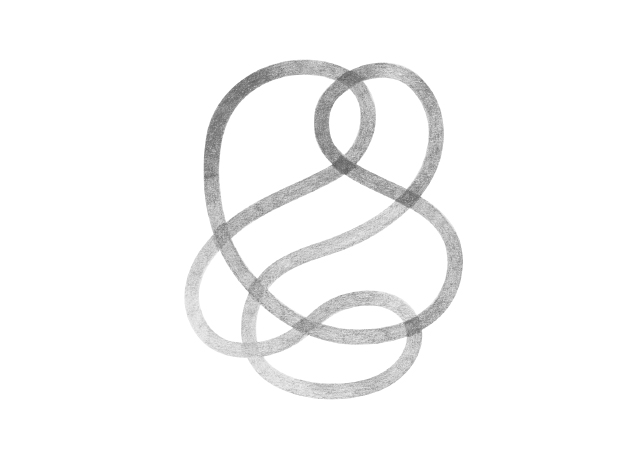
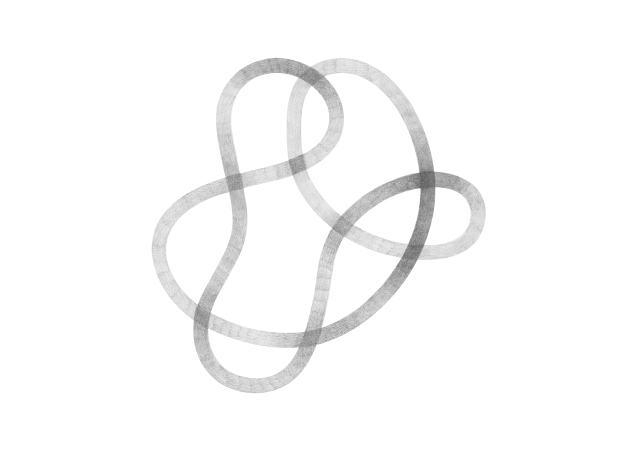
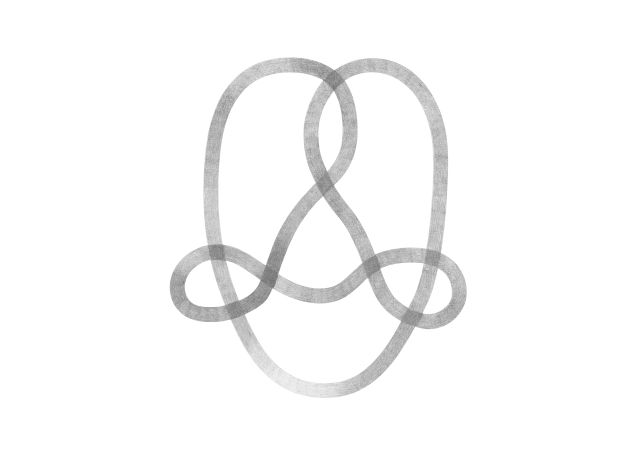
Visualisation is a powerful tool when communicating alternative ways of thinking and "seeing" things. Through visualisation, I found another way of thinking about nodes and links. I made "Knotwork" drawings of knots with eight crossings, each representing a node in our homebrewed network. The crossings could be seen as redistribution points (as in the classic definition of a node), or perhaps an overlapping area of linkage. In respect to thinking about nodes as knots, I found that when the knot is unraveled, the nodes and the links are the same thing.
The Network we (de)Served Publication
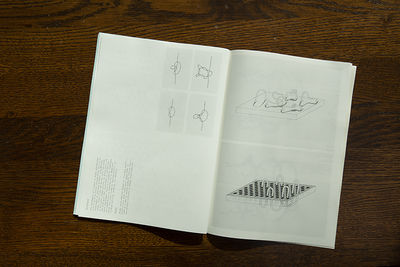
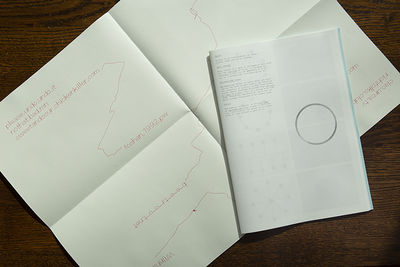
My research was published in the form of both web- and printed zines.
Web zine
The web zine is available at: https://issue.xpub.nl/08/Research/b-e-e-t.r-o-o-t.net/
An alternate on-page layout is also available at: http://beetroot.simonbrowne.biz
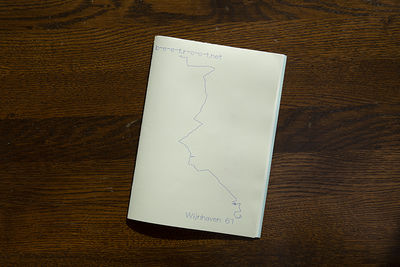
1. An A2 cover (folded down to A4) with drawings made by a pen plotter of my GPS walks. 2. My research pages. These are unbound, with a rotating orientation of text an image. The idea was to allow the reader to reorder pages and create their own pagination. 3. A collection of texts I have published online that influenced my thinking during the project. This is bound, and printed on blue paper to differentiate it from the rest of the zine.

