User:Bohye Woo/labour experiment: Difference between revisions
No edit summary |
|||
| Line 65: | Line 65: | ||
</source> | </source> | ||
===Step 2: | ===Step 2: Visualizing my labour=== | ||
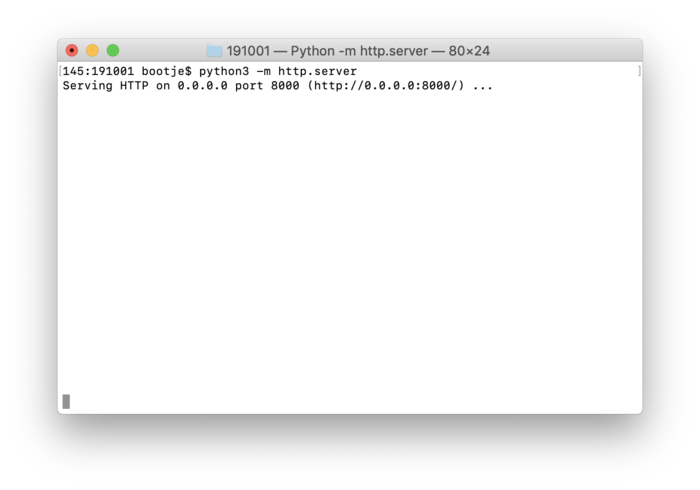
[[File:Bo-graduation-project-02.png|700px|thumbnail|right|http.server (possible plan: in my Pi working with Screen]] | [[File:Bo-graduation-project-02.png|700px|thumbnail|right|http.server (possible plan: in my Pi working with Screen]] | ||
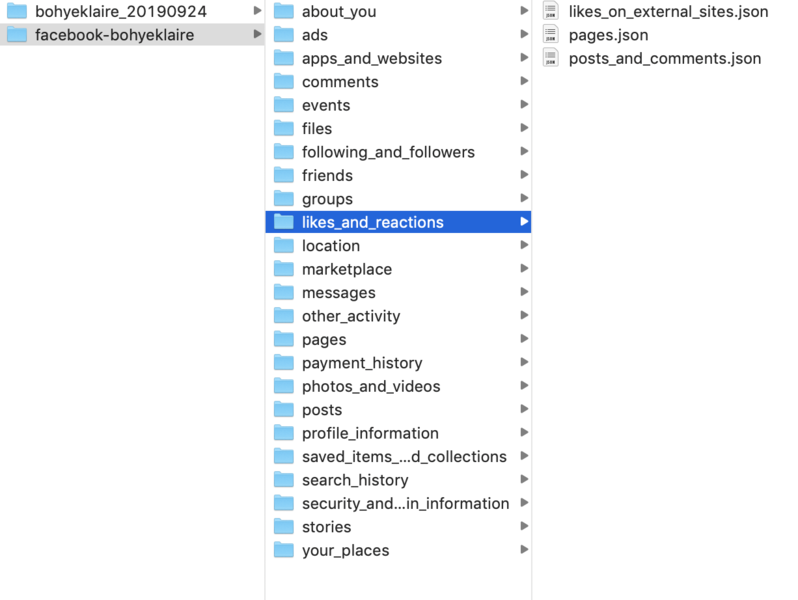
[[File:Bo-graduation-project-01.png|700px|thumbnail|right|Visualizing my likes in timeline]] | [[File:Bo-graduation-project-01.png|700px|thumbnail|right|Visualizing my likes in timeline]] | ||
Revision as of 12:39, 2 October 2019
Labour investigation in social media
This is a small prototyping with my personal data created from Facebook and Instagram. I call this experiment as a 'crime scene case' in which I will make an investigation report, it might lead me to start on a new study case. By downloading my personal datas I produced, I would like to delve into investigate what kinds of data I have produced, To create this data what labour is being used, how many time I worked to create them. I will visualize them to see the possibilities of materializing the labour.
Step 1: Extracting && Analyzing my data
What data has been collected? I've collected my 9 years of social media experience in JSON file.
A JSON file that collected my likes on posts
{
  "reactions": [
    {
      "timestamp": 1569322034,
      "data": [
        {
          "reaction": {
            "reaction": "LIKE",
            "actor": "Bo Woopsie"
          }
        }
      ],
      "title": "Bo Woopsie likes Roosje Klap's post."
    },
    {
      "timestamp": 1568990971,
      "data": [
        {
          "reaction": {
            "reaction": "LIKE",
            "actor": "Bo Woopsie"
          }
        }
      ],
      "title": "Bo Woopsie likes Shinyoung Kim's photo."
    },
    {
      "timestamp": 1568757503,
      "data": [
        {
          "reaction": {
            "reaction": "LIKE",
            "actor": "Bo Woopsie"
          }
        }
      ],
      "title": "Bo Woopsie likes Cramer Florian's album: Public Library | Latag."
    },
    {
      "timestamp": 1567672802,
      "data": [
        {
          "reaction": {
            "reaction": "LIKE",
            "actor": "Bo Woopsie"
          }
        }
      ],
      "title": "Bo Woopsie likes Michel Hoogervorst's photo."
    },
]
}
Step 2: Visualizing my labour
<!DOCTYPE html>
<html>
	<head>
		<meta charset="utf-8">
		<title>Let's publish our labour</title>

		<style type="text/css">
			svg {
				border: 1px solid gray;
			}
			circle.item {
				fill: green;
			}

		</style>
	</head>

	<body>
		<div id="content"></div>
		<svg id="graph" width=5000 height=100></svg>
	</body>

	<script src="d3/d3.min.js"></script>
	<script type="text/javascript">

		d3.json ("posts_and_comments.json").then(data => {
			console.log("data", data)

			let start = d3.min(data.reactions, d=>d.timestamp),
				end = d3.max(data.reactions, d=>d.timestamp);
			console.log("min", start, "max", end);

			let	pos = d3.scaleLinear().domain([start, end]).range([0, 5000]);
			window.pos = pos;

			d3.select("#graph")
				.selectAll(".item")
				.data(data.reactions)
				.enter()
				.append("circle")
				.attr("cx", d => pos(d.timestamp))
				.attr("cy", 10)
				.attr("r", 2)
				.attr("class", "item")
				.append("title")
				.text(d => d.title);
				//same as: .text(function(d) { return d.title });
		})

	</script>
</html>
Step 3: Adding more datas to compare different datas
Added 'other_peoples_posts_to_your_timeline.json' & 'likes_on_external_sites.json'
<script type="text/javascript">
	d3.json ("posts_and_comments.json").then(data => {
		console.log("data", data)


		let start = d3.min(data.reactions, d=>d.timestamp),
			end = d3.max(data.reactions, d=>d.timestamp);
		console.log("min", start, "max", end);

		let	pos = d3.scaleLinear().domain([start, end]).range([0, 5000]);
		window.pos = pos;

		d3.select("#graph")
			.selectAll(".item")
			.data(data.reactions)
			.enter()
			.append("rect")
			.attr("x", d => pos(d.timestamp))
			.attr("y", 0)
			.attr("width", 2)
			.attr("height", 2)
			.attr("class", "item")
			.append("title")
			.text(d => d.title)
			//same as: .text(function(d) { return d.title });
	})


	d3.json ("likes_on_external_sites.json").then(data => {
		console.log("data", data)

		let start = d3.min(data.other_likes, d=>d.timestamp),
			end = d3.max(data.other_likes, d=>d.timestamp);
		console.log("min", start, "max", end);

		let	pos = d3.scaleLinear().domain([start, end]).range([0, 5000]);
		window.pos = pos;

		d3.select("#graph")
			.selectAll(".item2")
			.data(data.other_likes)
			.enter()
			.append("circle")
			.attr("cx", d => pos(d.timestamp))
			.attr("cy", 10)
			.attr("r", 2)
			.attr("class", "item2")
			.append("title")
			.text(d => d.title);
	})


	d3.json ("other_peoples_posts_to_your_timeline.json").then(data => {
		data = data.wall_posts_sent_to_you
		console.log("data3", data)

		let start = d3.min(data.activity_log_data, d=>d.timestamp),
			end = d3.max(data.activity_log_data, d=>d.timestamp);
		console.log("min", start, "max", end);

		let	pos = d3.scaleLinear().domain([start, end]).range([0, 5000]);
		window.pos = pos;

		d3.select("#graph")
			.selectAll(".item3")
			.data(data.activity_log_data)
			.enter()
			.append("circle")
			.attr("cx", d => pos(d.timestamp))
			.attr("cy", 15)
			.attr("r", 2)
			.attr("class", "item3")
			.append("title")
			.text(d => d.title);
	})
</script>
Step 4:
I re-write with a new style of Javascript that has new keywords that's added. It's a new way allows us to write linearly.
- Async
Async is a utility module which provides straight-forward, powerful functions for working with asynchronous JavaScript.
I need to load everything at the same time to see the whole labour I produced.
Promises let you
Promises and Legend — D3
=Legend
I loaded different JSON files every time. And the problem is that they're not in a same scale. So I need to find total minimum and maximam to What is interesting to see is to see the whole timeline of my labour.


