User:Simon/Special Issue 8/summary second half trim: Difference between revisions
| Line 1: | Line 1: | ||
=Visualising network topologies= | =Visualising network topologies= | ||
[[User:Simon/Special_Issue_8/Network_of_possibilities Network of possibilities]] | [[http://pzwiki.wdka.nl/mediadesign/User:Simon/Special_Issue_8/Network_of_possibilities Network of possibilities]] | ||
==GPS walking== | ==GPS walking== | ||
Revision as of 13:56, 8 April 2019
Visualising network topologies
GPS walking
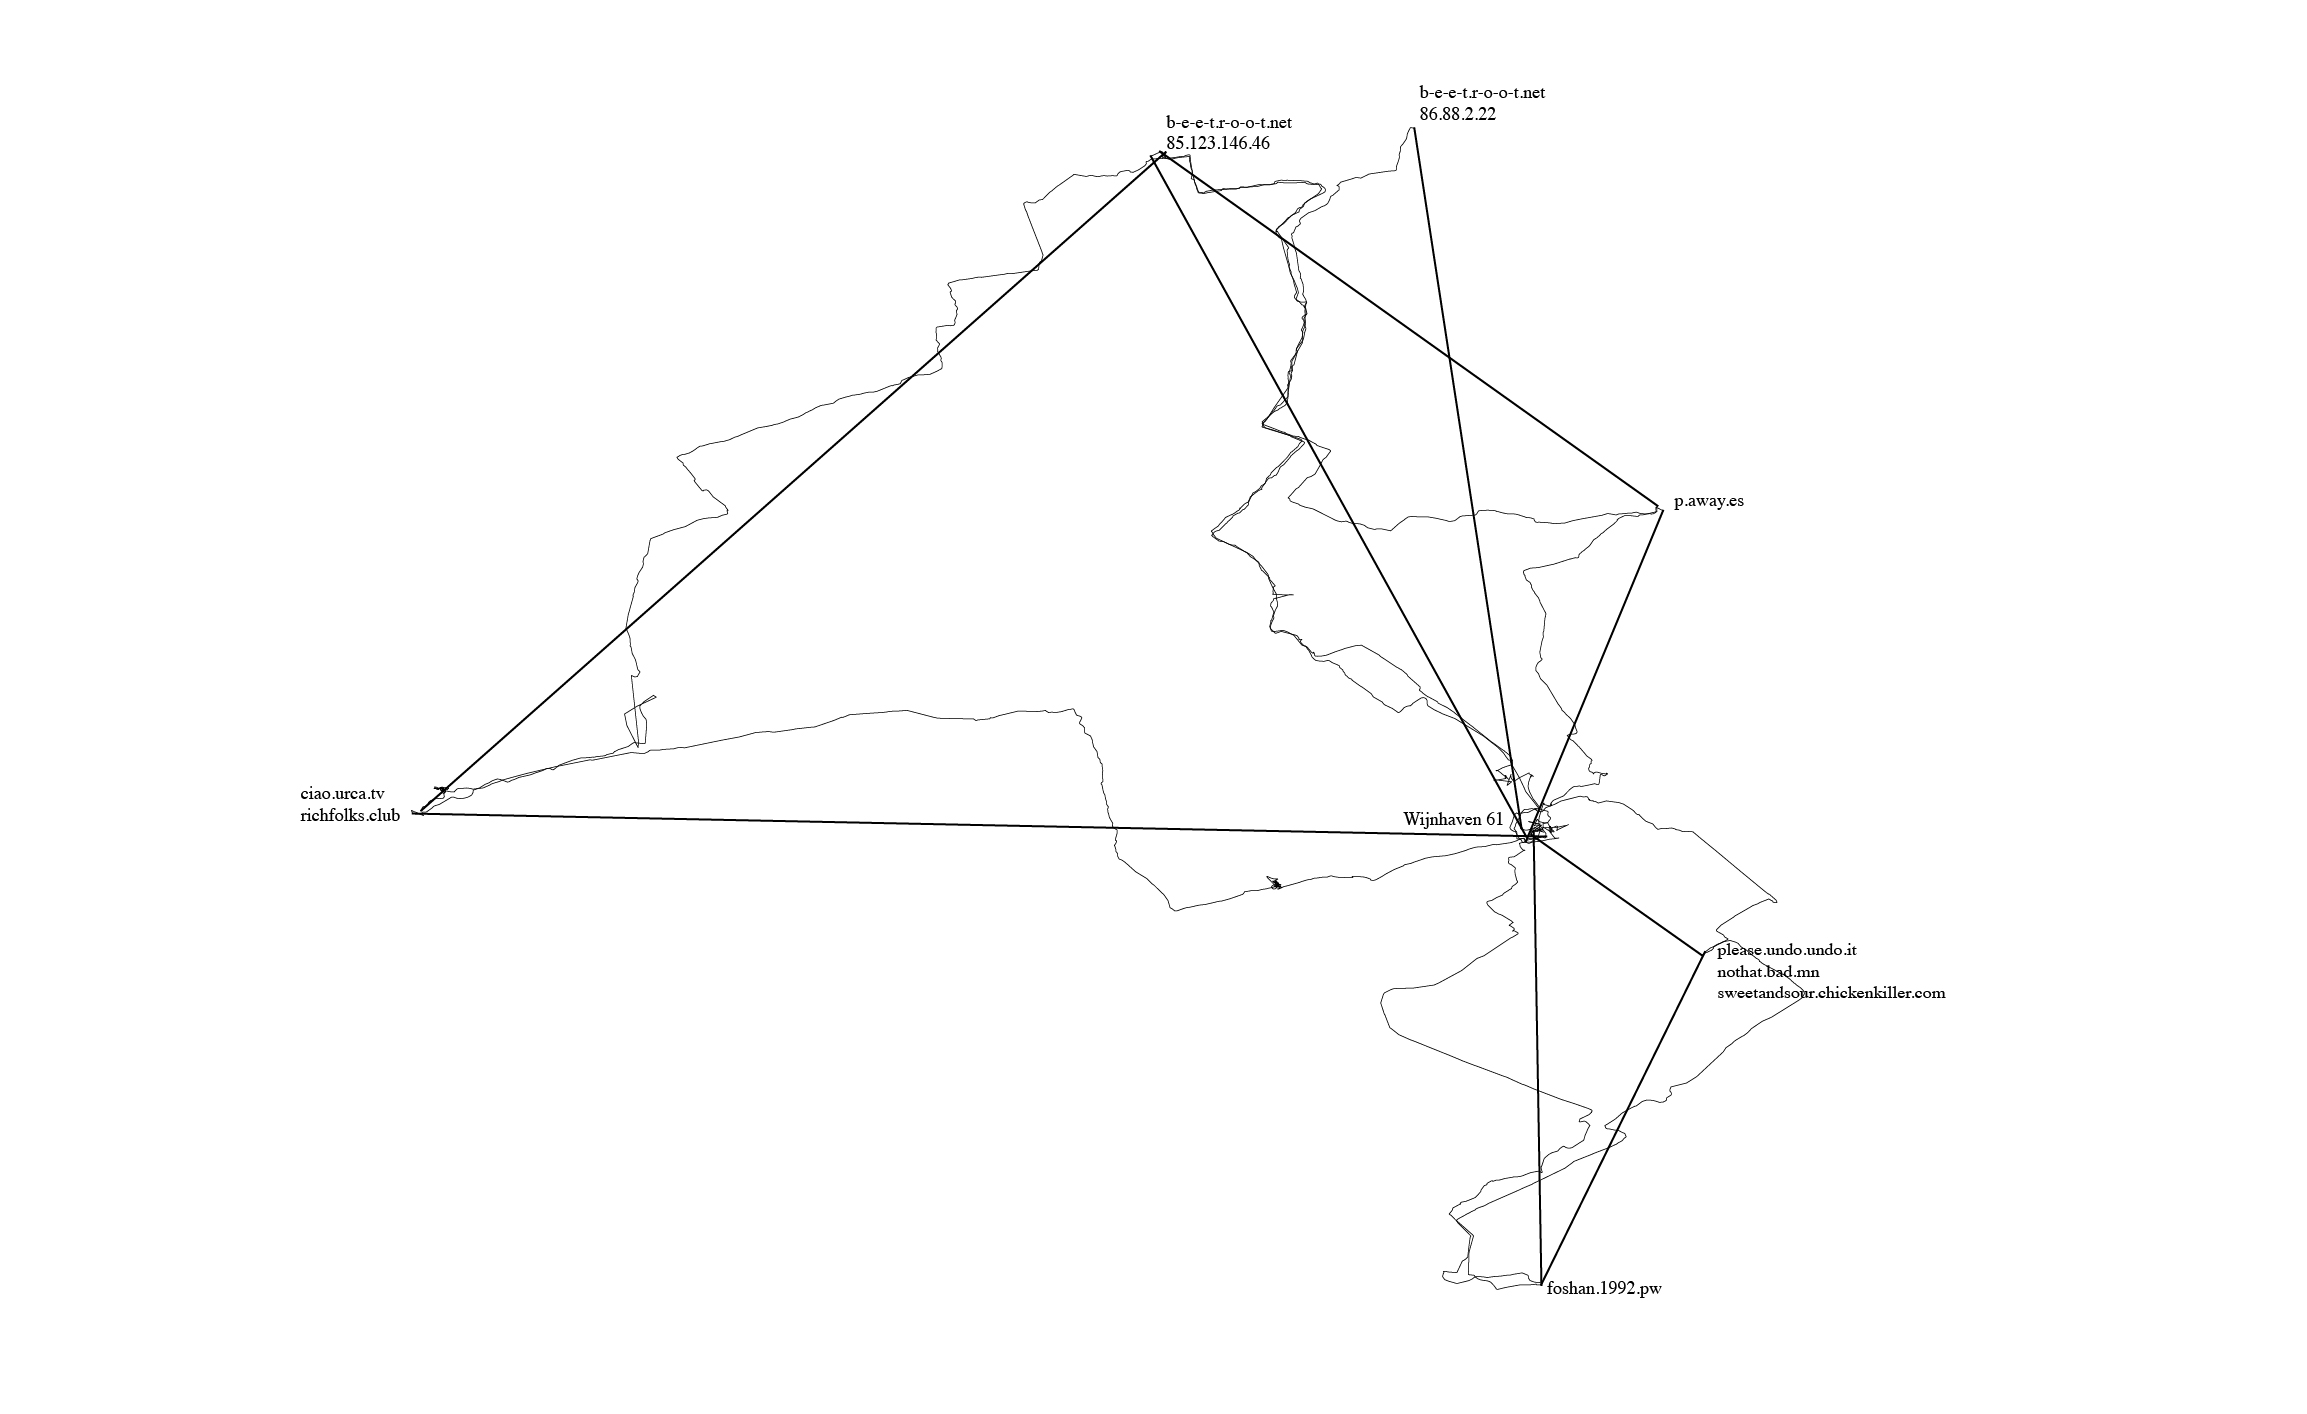
One of the actions I included in my network of possibilities was to begin walking between different points in our network (our homeservers, and also the PZI building where we gathered to have classes and work on Special Issue 08).
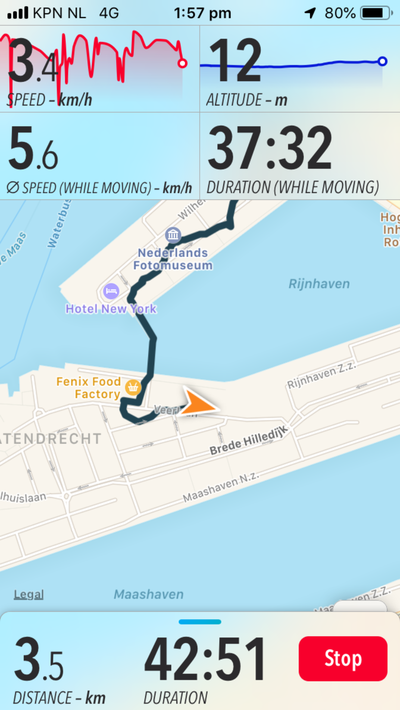
I used a hiking app called "Trails", which would record my walk over GPS, from which I could export the .gpx file generated after walking, and then load it into a program for geospatial information called QGIS. An interesting feature of this software is in how it represents the line created by walking - you can upload it as trackpoints (snapshots of your location determined by satellite trilateration), and also as straight lines between the trackpoints. I started to realise how abstraction was a large part of mapping, which reminded me of the map/territory problem.
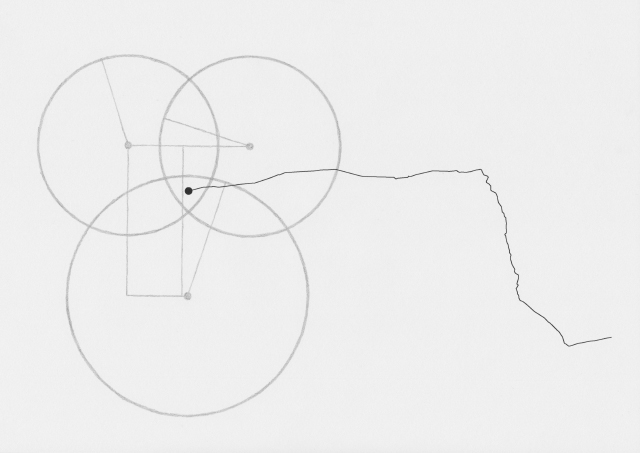
I began to make drawings, which, by being devoid of text that would explain them, could act as illustrations of how this map was being made:
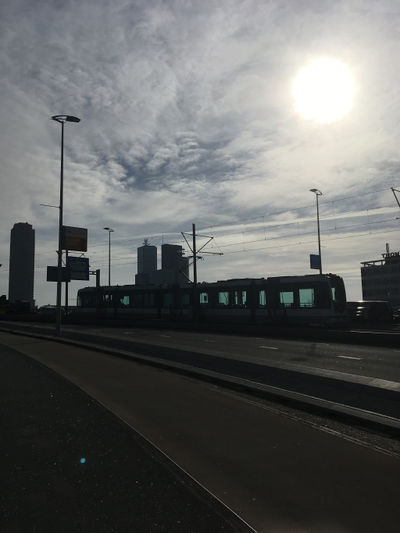
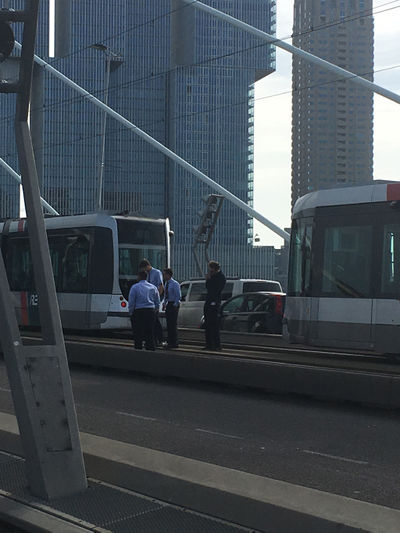
During each walk I would take photos and write notes on thoughts that came up. I began noticing other networks around me.
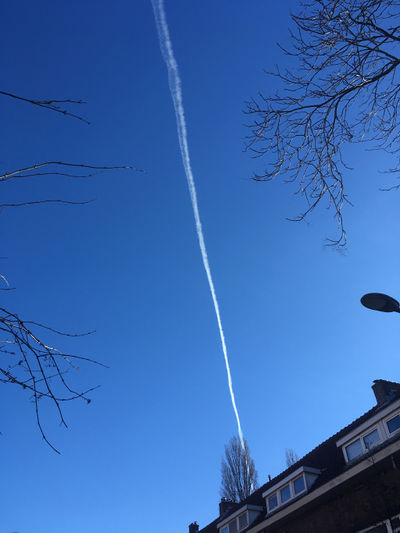
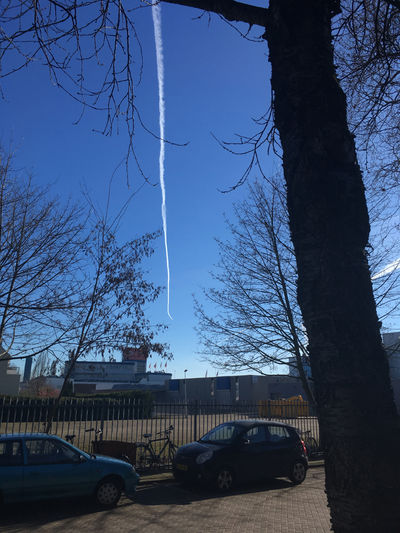
Flight paths that produced contrails (or chemtrails):
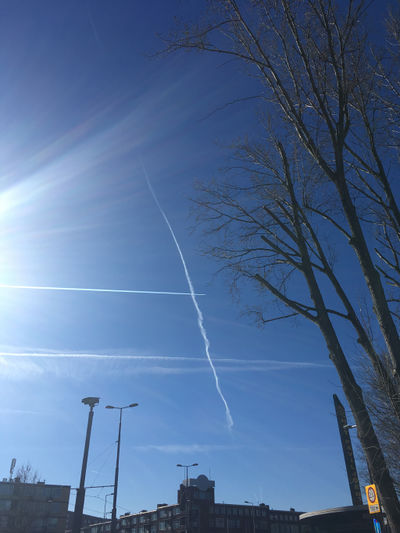
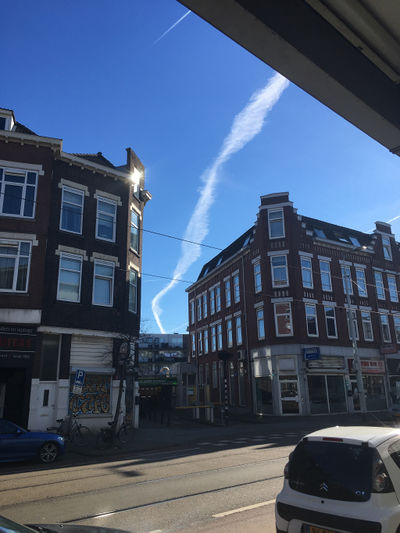
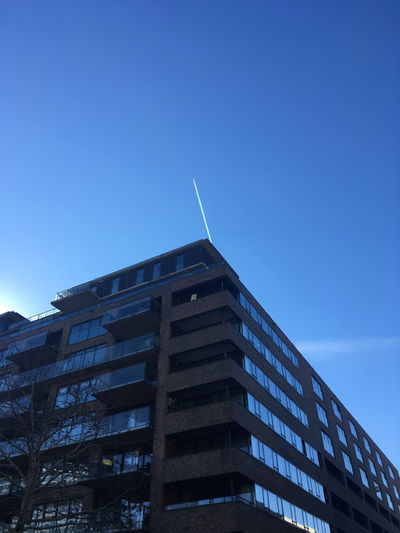
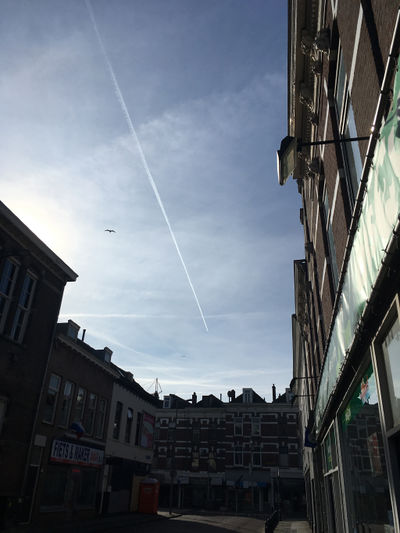
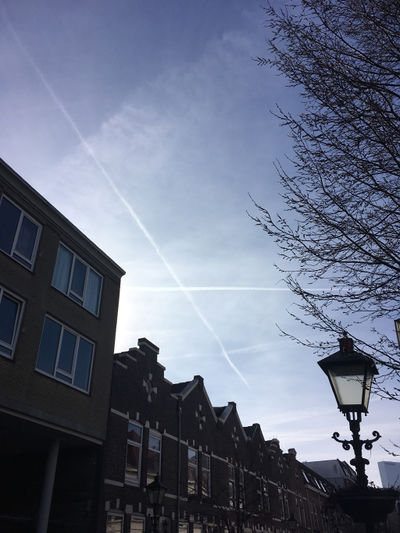
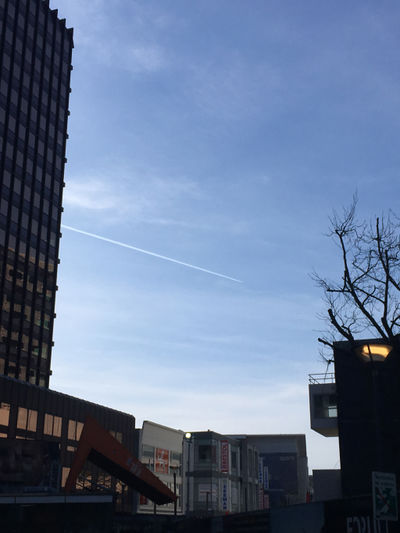
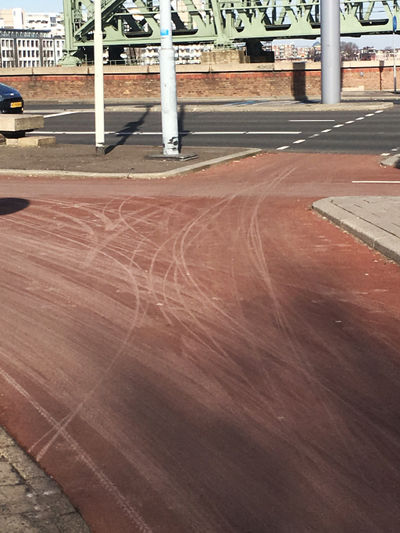
Bicycle networks:
Each walk became an act of drawing (using GPS) and also a meditation.
networked research
I also began to write down my thoughts on various topics that came up.
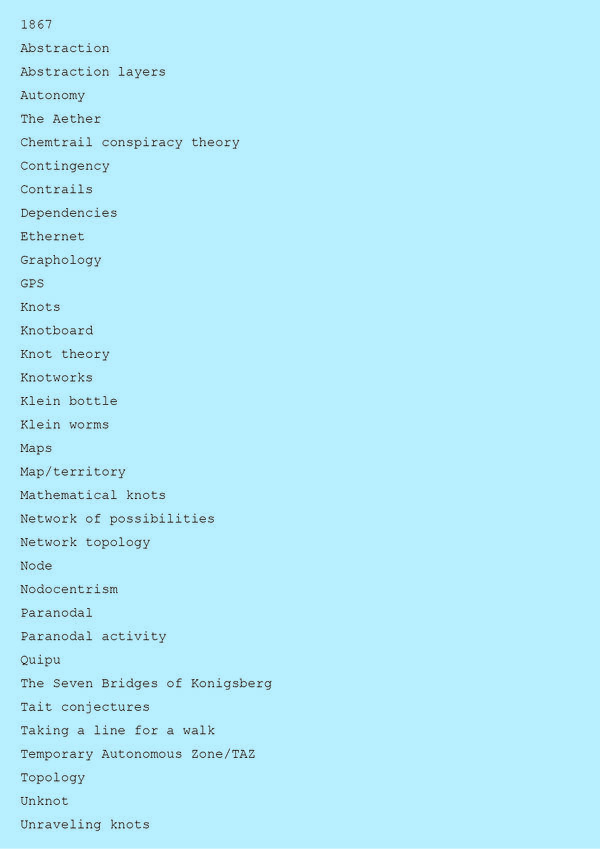
https://pad.xpub.nl/p/networked_research
As I wanted a fairly horizontal structure to my research, I decided to base the content for each page of my website on a walk.
Drawing visualisations
Drawing (by hand and using vectors) became a large part of the outcomes I produced as part of my research. The drawings often shifted between "hand-drawn" and "computer-drawn", for example, I would use a .svg file made from one of my GPS walks in a vector graphics program, then print it and hand-draw with pencil over the top.
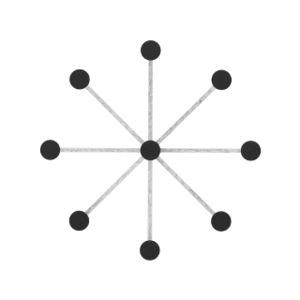
Abstraction became a key interest, and I started to think more about how these different ways of visualising all employed some level of abstraction in order to communicate. This brought me back to the typical idea of displaying network topology, as nodes and straight lines:
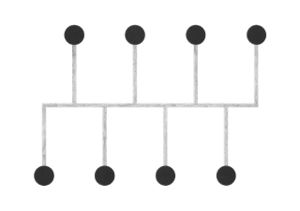
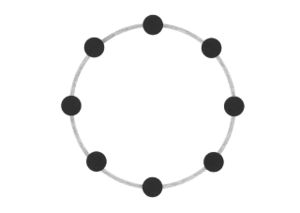
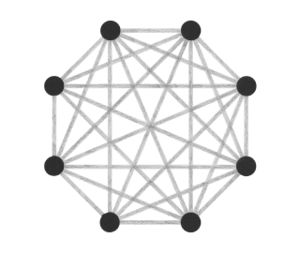
The drawings I made while GPS walking employed straight lines between trackpoints. However, this was just an abstraction - there are no straight lines in reality. In fact, the more accurately I would be able to map the network, the less useful it would be as a readily comprehensible visualisation. I also noticed that at points the GPS signal had become confused or obscured - this happened when I went into buildings (such as a cafe to buy a coffee) or when the signal might have been obscured by tall buildings around me. This produced knots, which I saw as analogous to nodes.
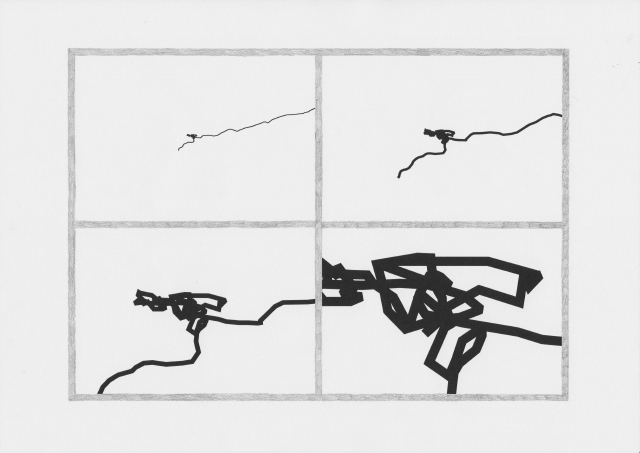
When I imported the lines I made by GPS walking into .svg format, I experimented with unraveling some of these knots, and then drew this process.
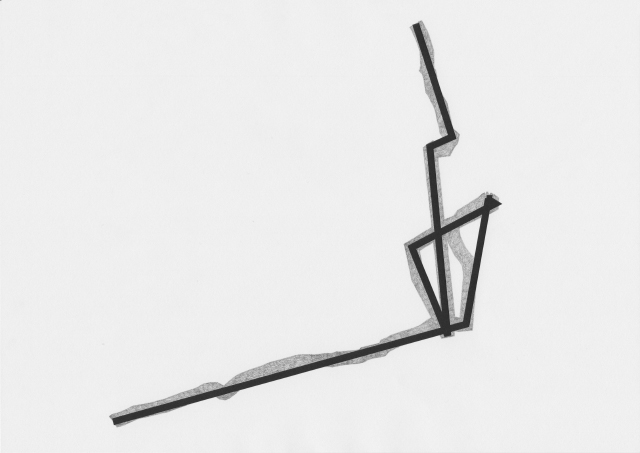
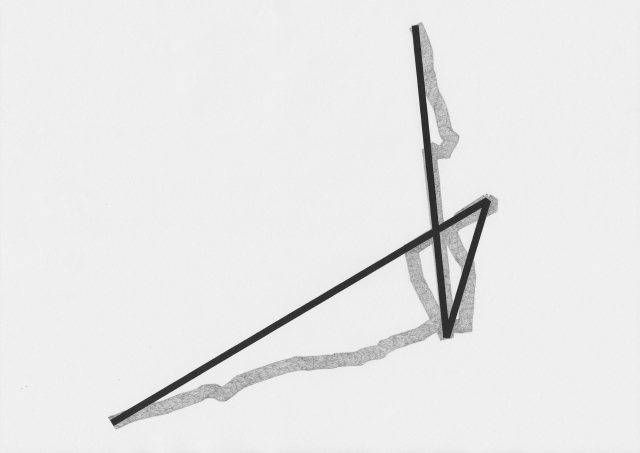
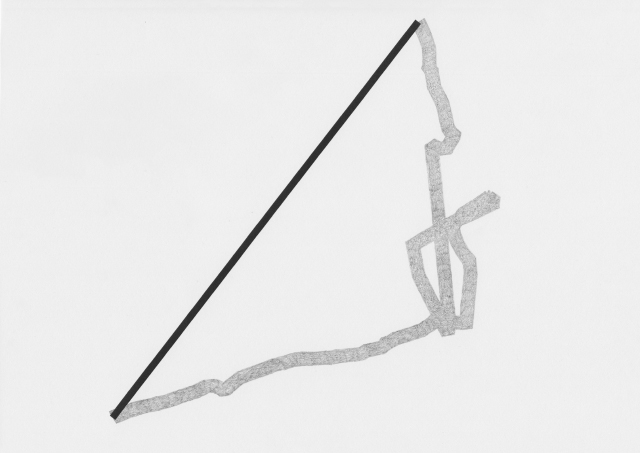
knotboard, knots and knotworks
A key reference point for my investigations into network topologies began with the klein form.
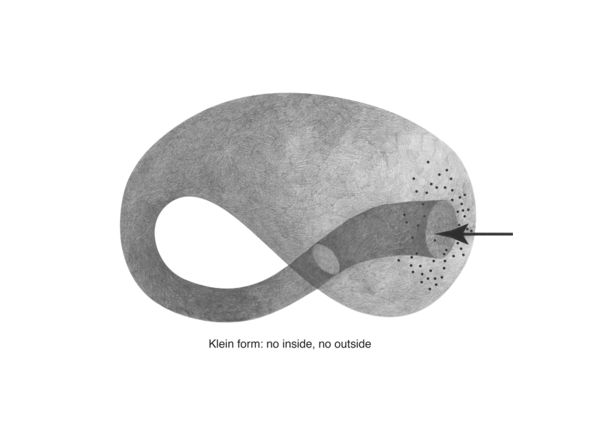
Klein forms are the basis for klein worms; illustrated in Radical Software:
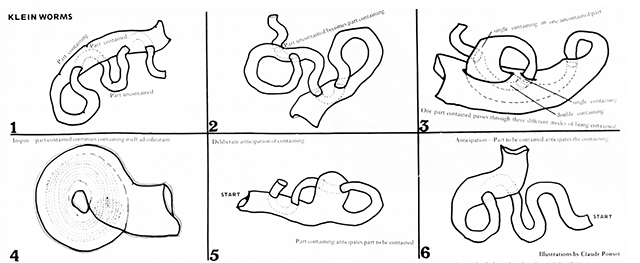
The knotboard I had made in the first half of the trimester proved a useful tool for thinking with my hands. I noticed that as a physical object, it was different from my drawings as it immediately had depth, and form, and as a result was affected by light, particularly shadows:
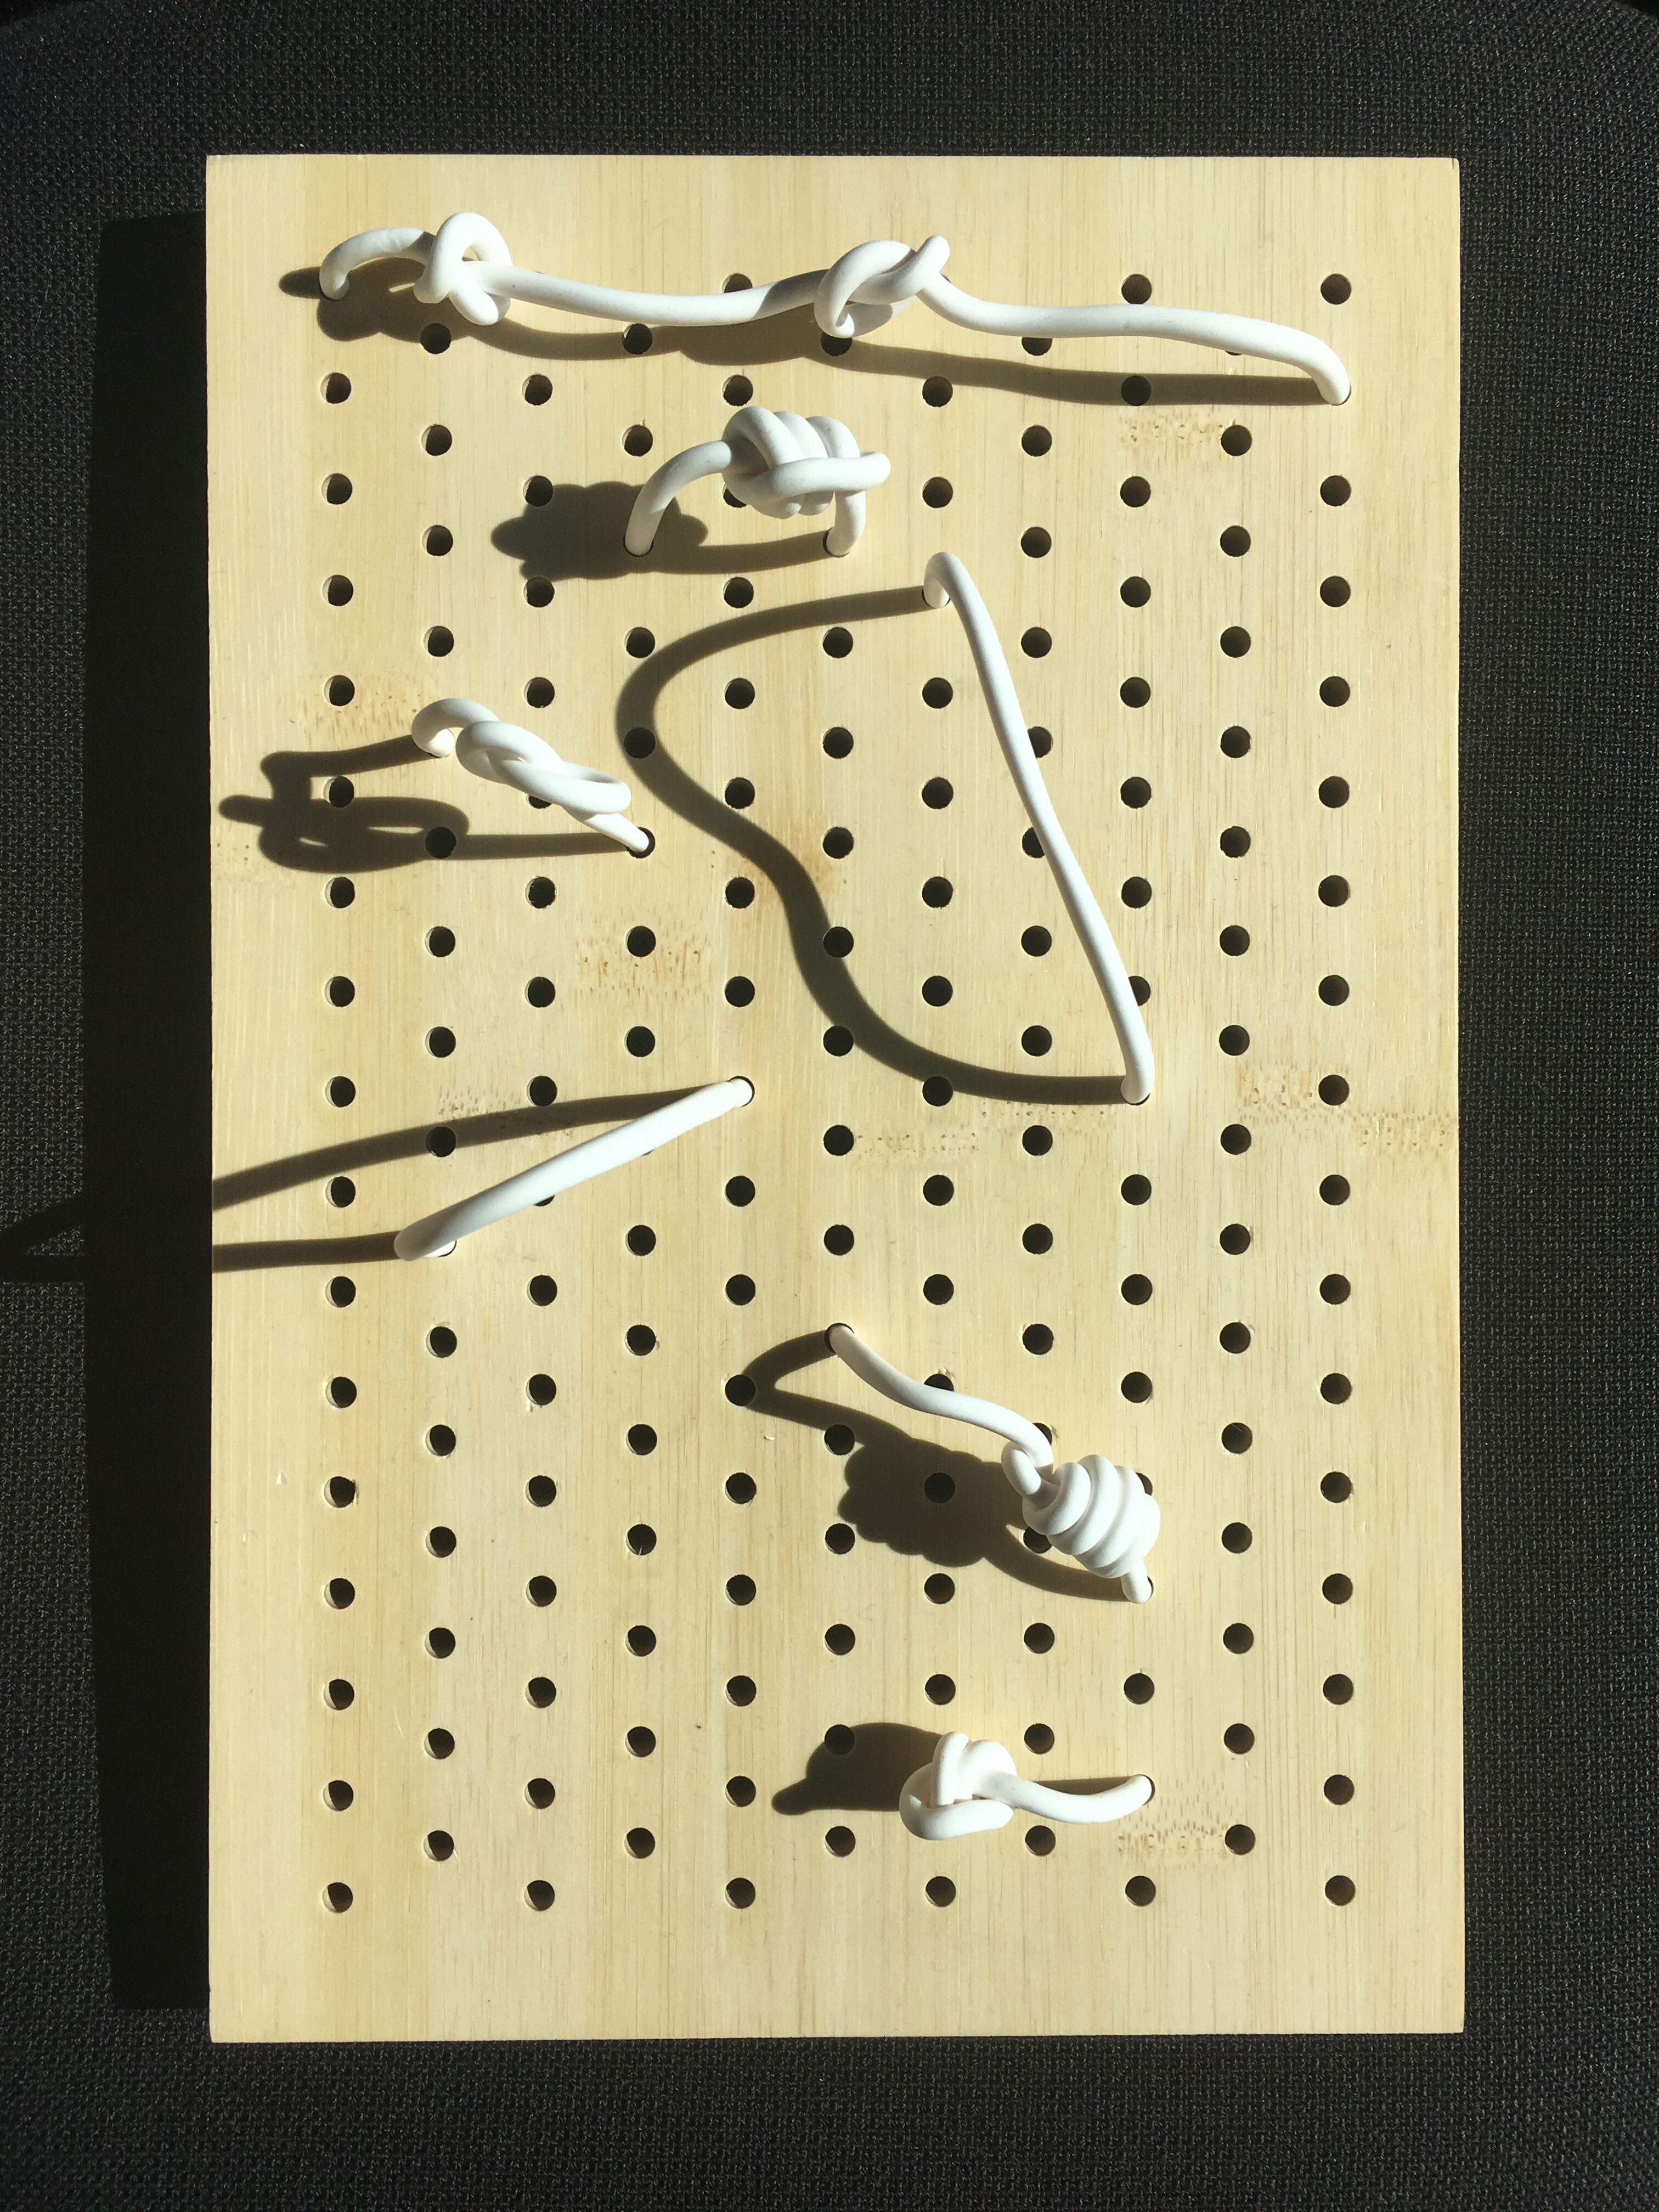
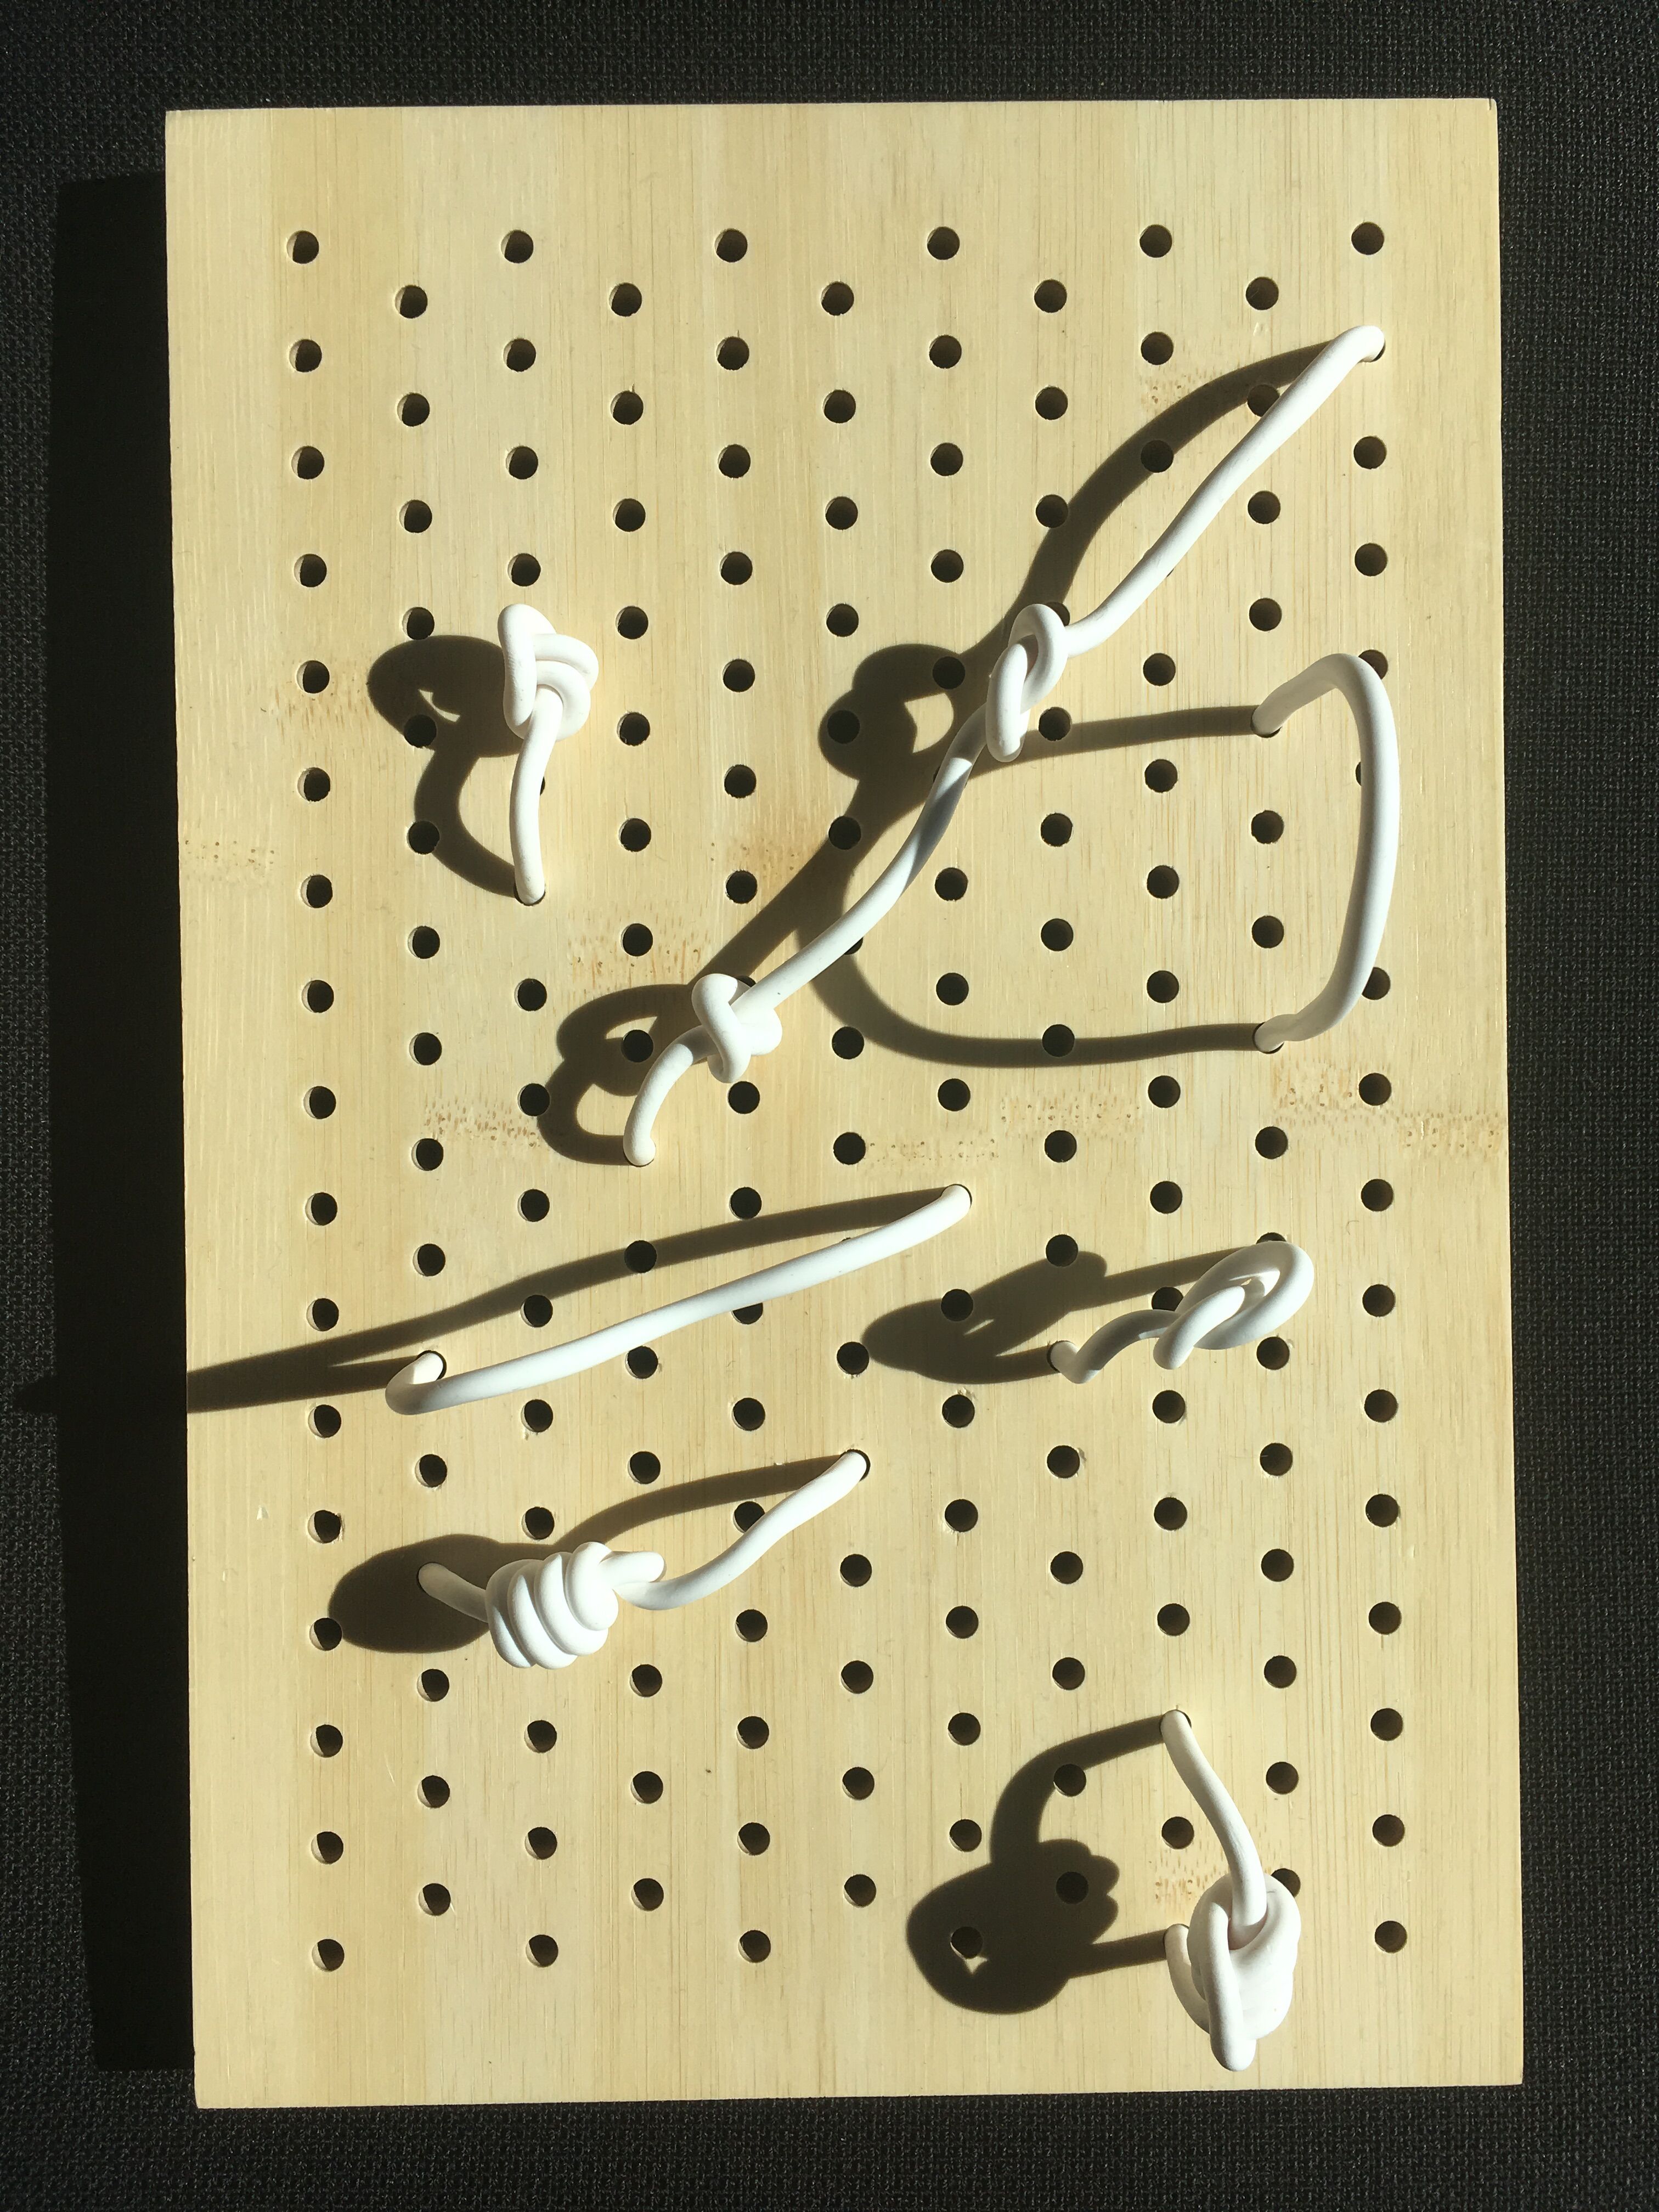
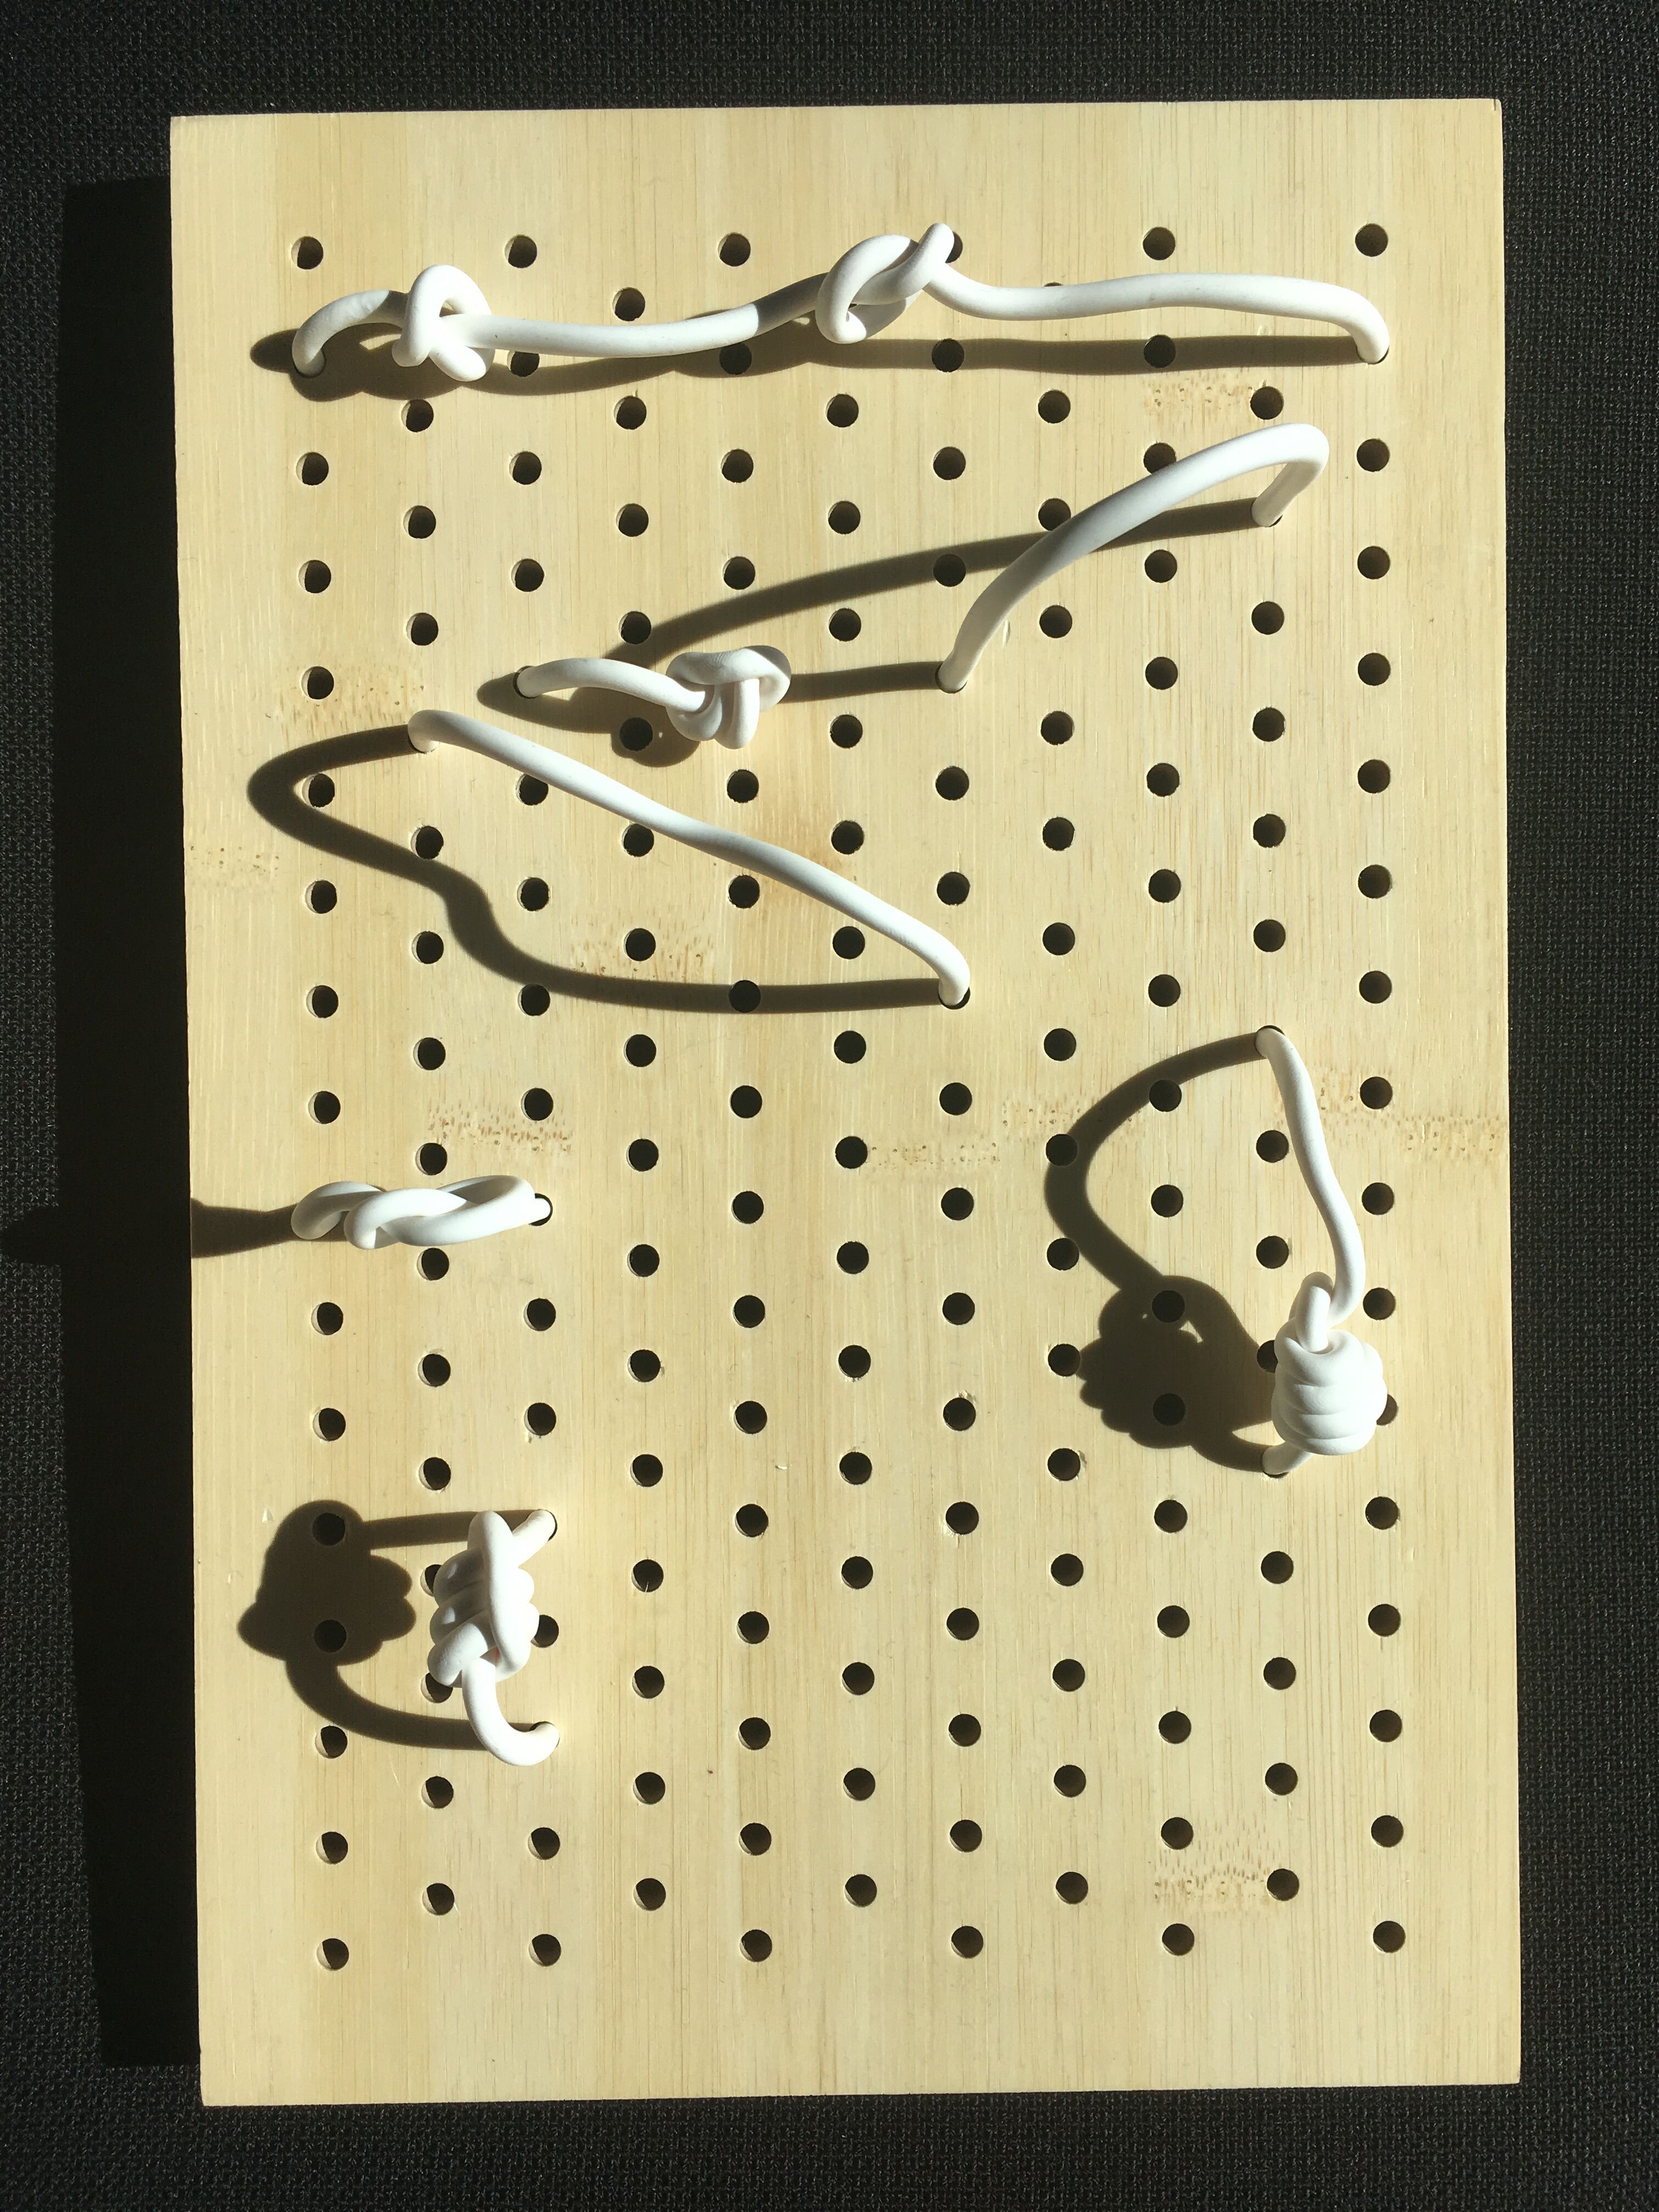
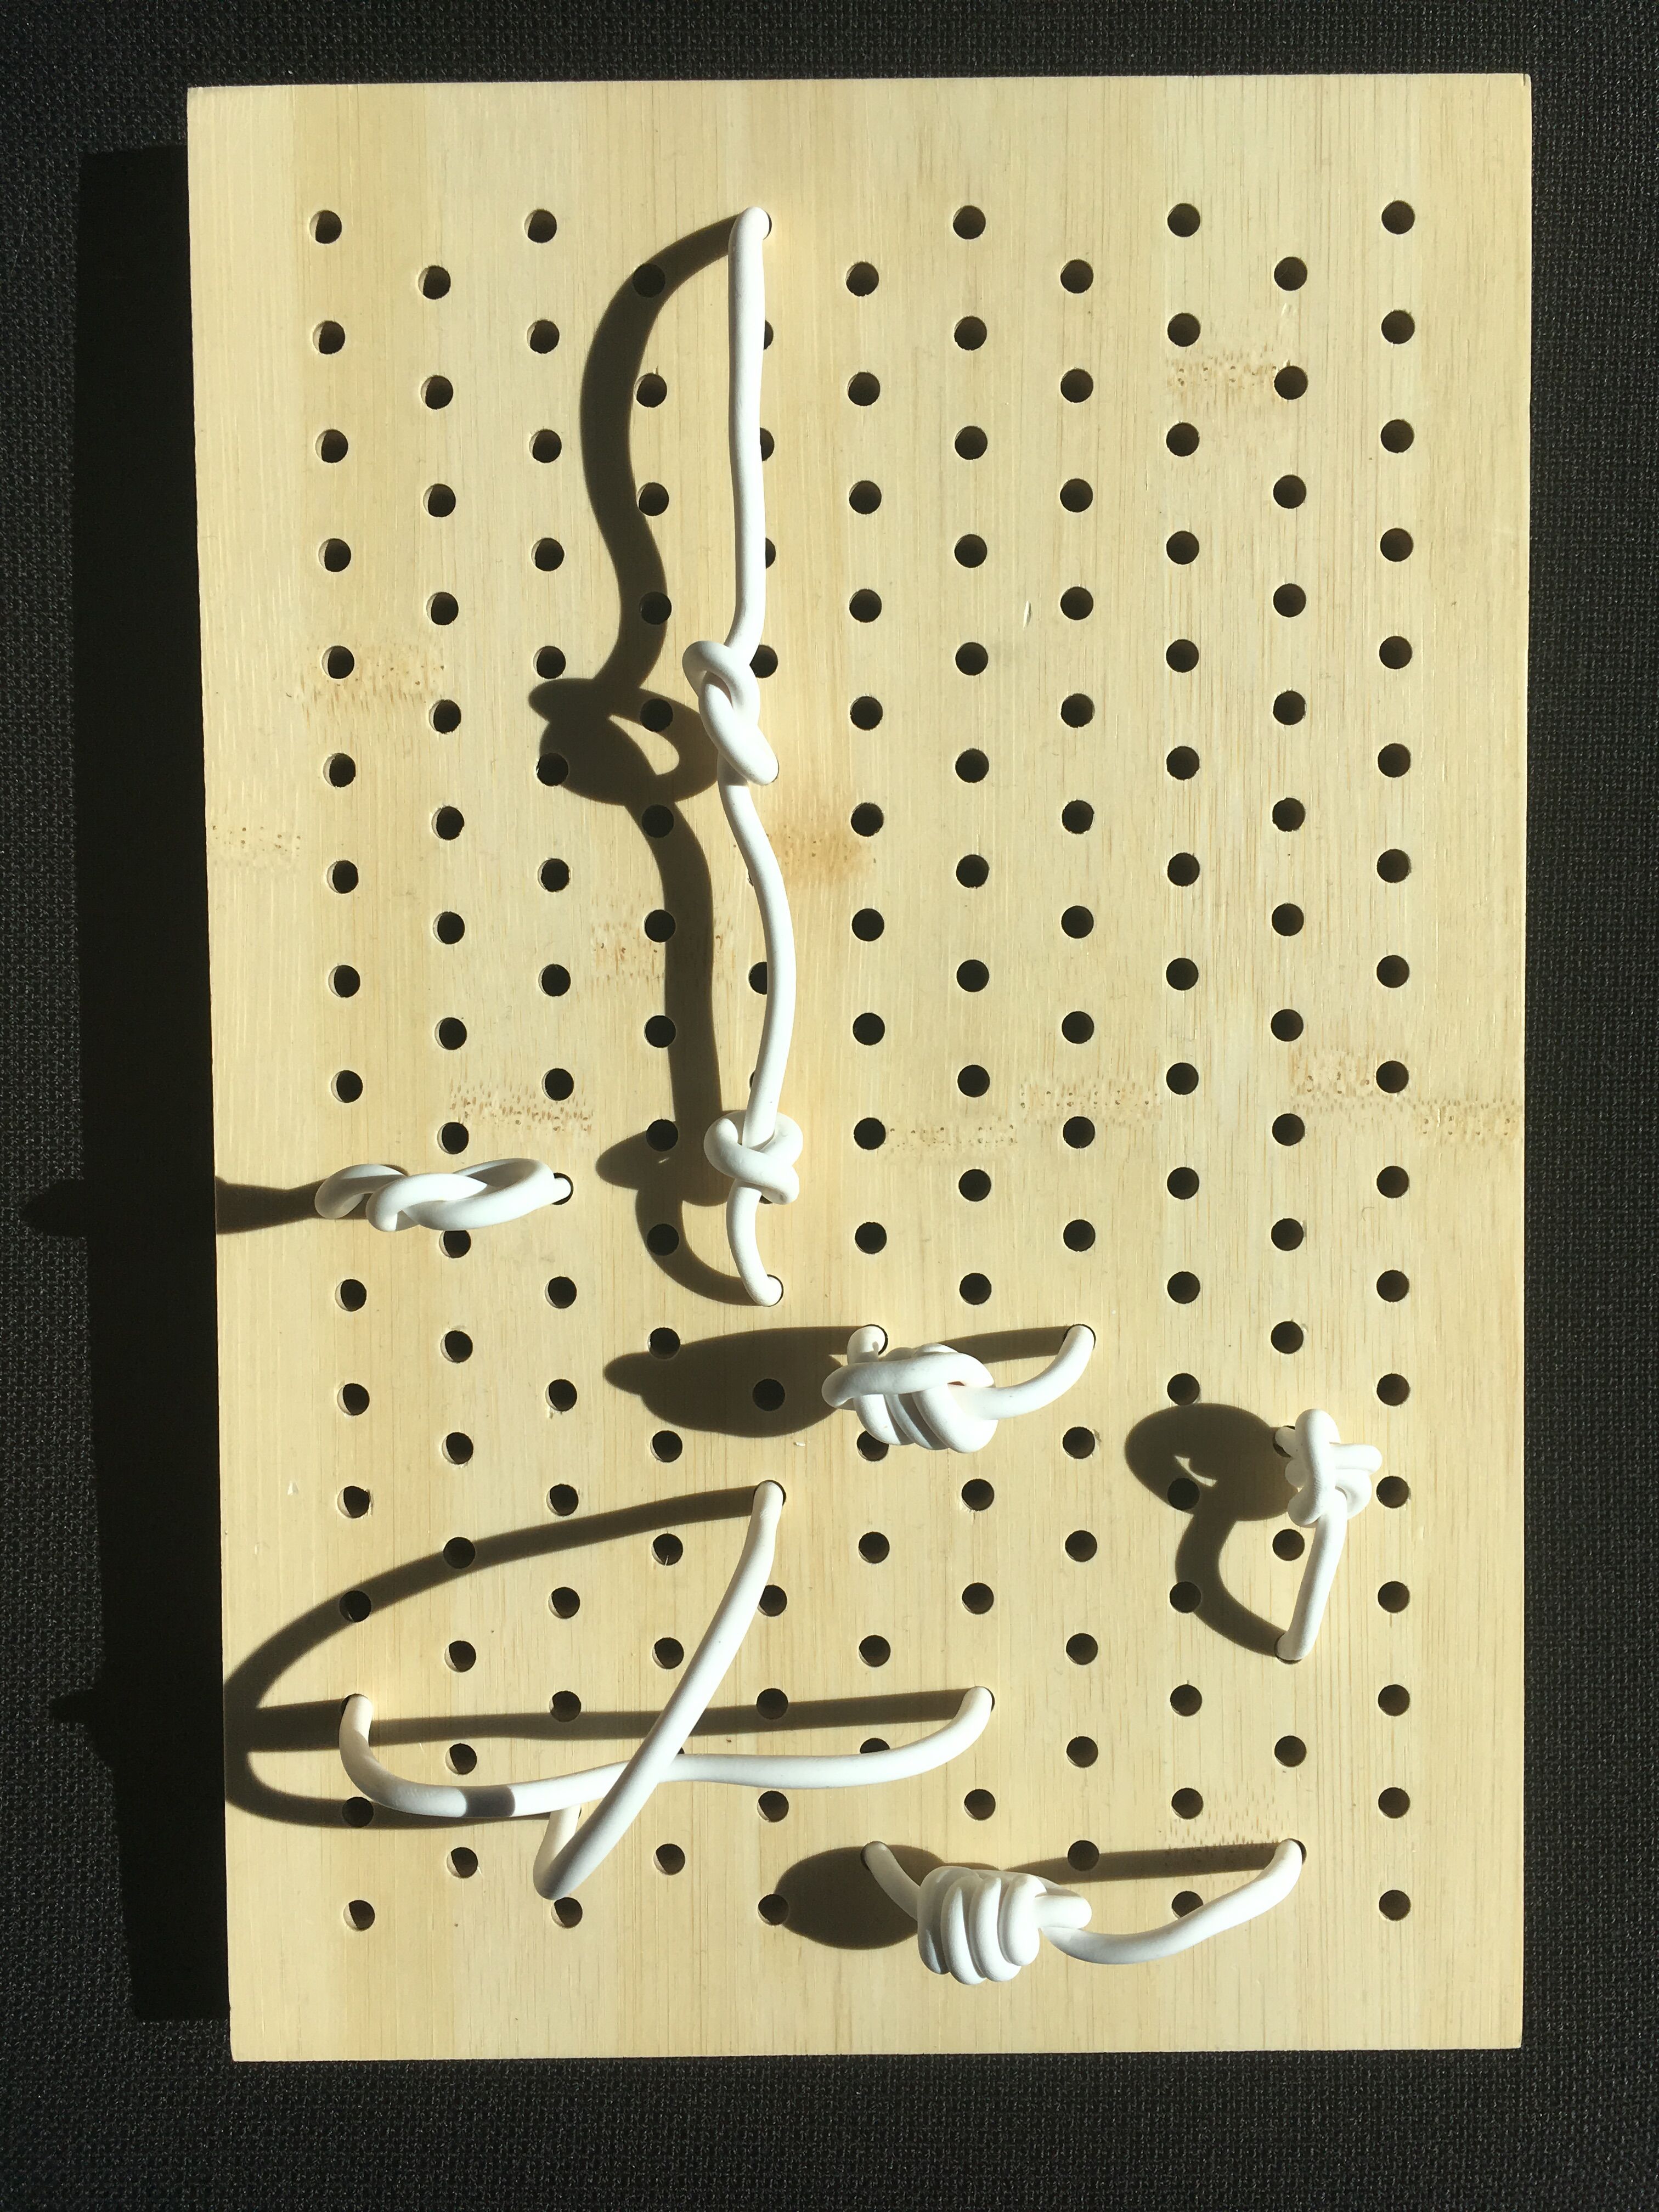
When configured in different ways, the knotboard took on a different presence. I made drawings from this, incorporating light and shadow as well as alternative ways of imagining the three-dimensional space the knotted links occupied:
Research into knot theory (a field of mathematics which studies the topology of knots) led me to discovering mathematical knots, which are different from the usual idea of a knot. I had previously explored knots as ways to record numbers (a notable reference being Quipu from ancient Andean cultures):
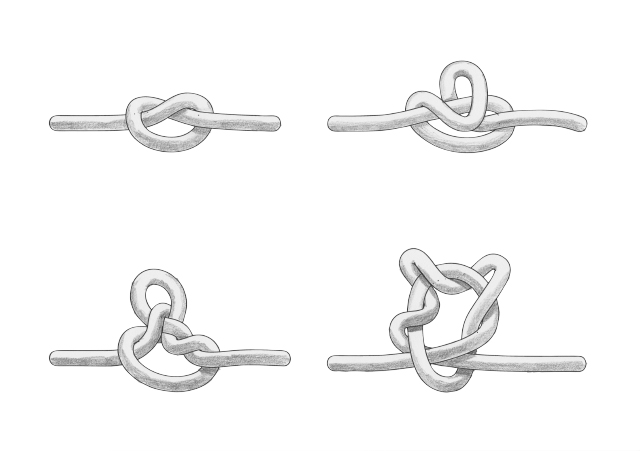
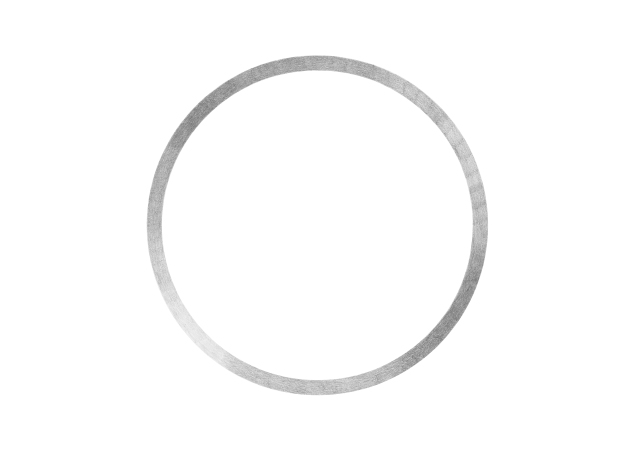
Mathematical knots are different, in that they are based on the embedding of a circle into three-dimensional Euclidean geometry R3. As such, they resemble closed loops. The first of these is the "unknot":
I imagined knots as nodes, which when unraveled would reveal that the node and the link are the same:
Visualisation is a powerful tool when communicating alternative ways of thinking and "seeing" things. Through visualisation, I found another way of thinking about nodes

