User:Laurier Rochon/prototyping/graphov: Difference between revisions
No edit summary |
No edit summary |
||
| Line 9: | Line 9: | ||
* Graphs are ugly? Yes. My computer is slow. | * Graphs are ugly? Yes. My computer is slow. | ||
* All done using Gephi, which is free and works pretty well. They use mainly a '.gexf' format, which is similar to XML to generate the graphs. Unfortunately, the documentation for this software blows. | * All done using Gephi, which is free and works pretty well. They use mainly a '.gexf' format, which is similar to XML to generate the graphs. Unfortunately, the documentation for this software blows. | ||
* The learning curve is very gentle, and the basic associative graph is very simple, it goes a little something like : | |||
Declare what it is you are graphing, and give them a unique id (the number 1,2,3,4). | |||
<source lang='text'> | |||
1 : "morning" | |||
2 : "midday" | |||
3 : "evening" | |||
4 : "night" | |||
</source> | |||
Then just create the relationships, and give an id to this relationship (1,2,3,4,5,6,7, etc.). Important, the number here has a very different meaning than in the previous step. | |||
<source lang='text'> | |||
1 : source=1 target=2 #(which means, go from "morning" to "midday") | |||
2 : source=2 target=3 #(midday to evening) | |||
3 : source=3 target=4 #(etc.) | |||
4 : source=4 target=1 #and over and over again | |||
5 : source=3 target=2 #... | |||
</source> | |||
== Ex1 : the original markov chain == | == Ex1 : the original markov chain == | ||
Revision as of 14:45, 21 May 2011
Visualizing markov chains
(work in progress)
Some notes
- I'm skeptical of 'data visualization', 'infographics' and the like. Furthermore, I don't feel completely qualified to draw conclusions from the more extensive graphs.
- I guess I consider this as a quick prototyping tool just to get a general overview of what's going on in a large set of data
- Graphs are ugly? Yes. My computer is slow.
- All done using Gephi, which is free and works pretty well. They use mainly a '.gexf' format, which is similar to XML to generate the graphs. Unfortunately, the documentation for this software blows.
- The learning curve is very gentle, and the basic associative graph is very simple, it goes a little something like :
Declare what it is you are graphing, and give them a unique id (the number 1,2,3,4).
1 : "morning"
2 : "midday"
3 : "evening"
4 : "night"
Then just create the relationships, and give an id to this relationship (1,2,3,4,5,6,7, etc.). Important, the number here has a very different meaning than in the previous step.
1 : source=1 target=2 #(which means, go from "morning" to "midday")
2 : source=2 target=3 #(midday to evening)
3 : source=3 target=4 #(etc.)
4 : source=4 target=1 #and over and over again
5 : source=3 target=2 #...
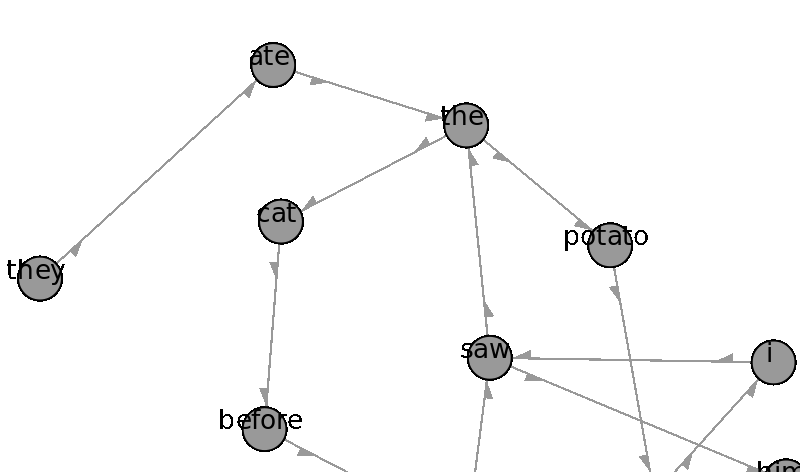
Ex1 : the original markov chain
Using the following sentences : They ate the cat before he saw the potato. He knew it. I saw him.
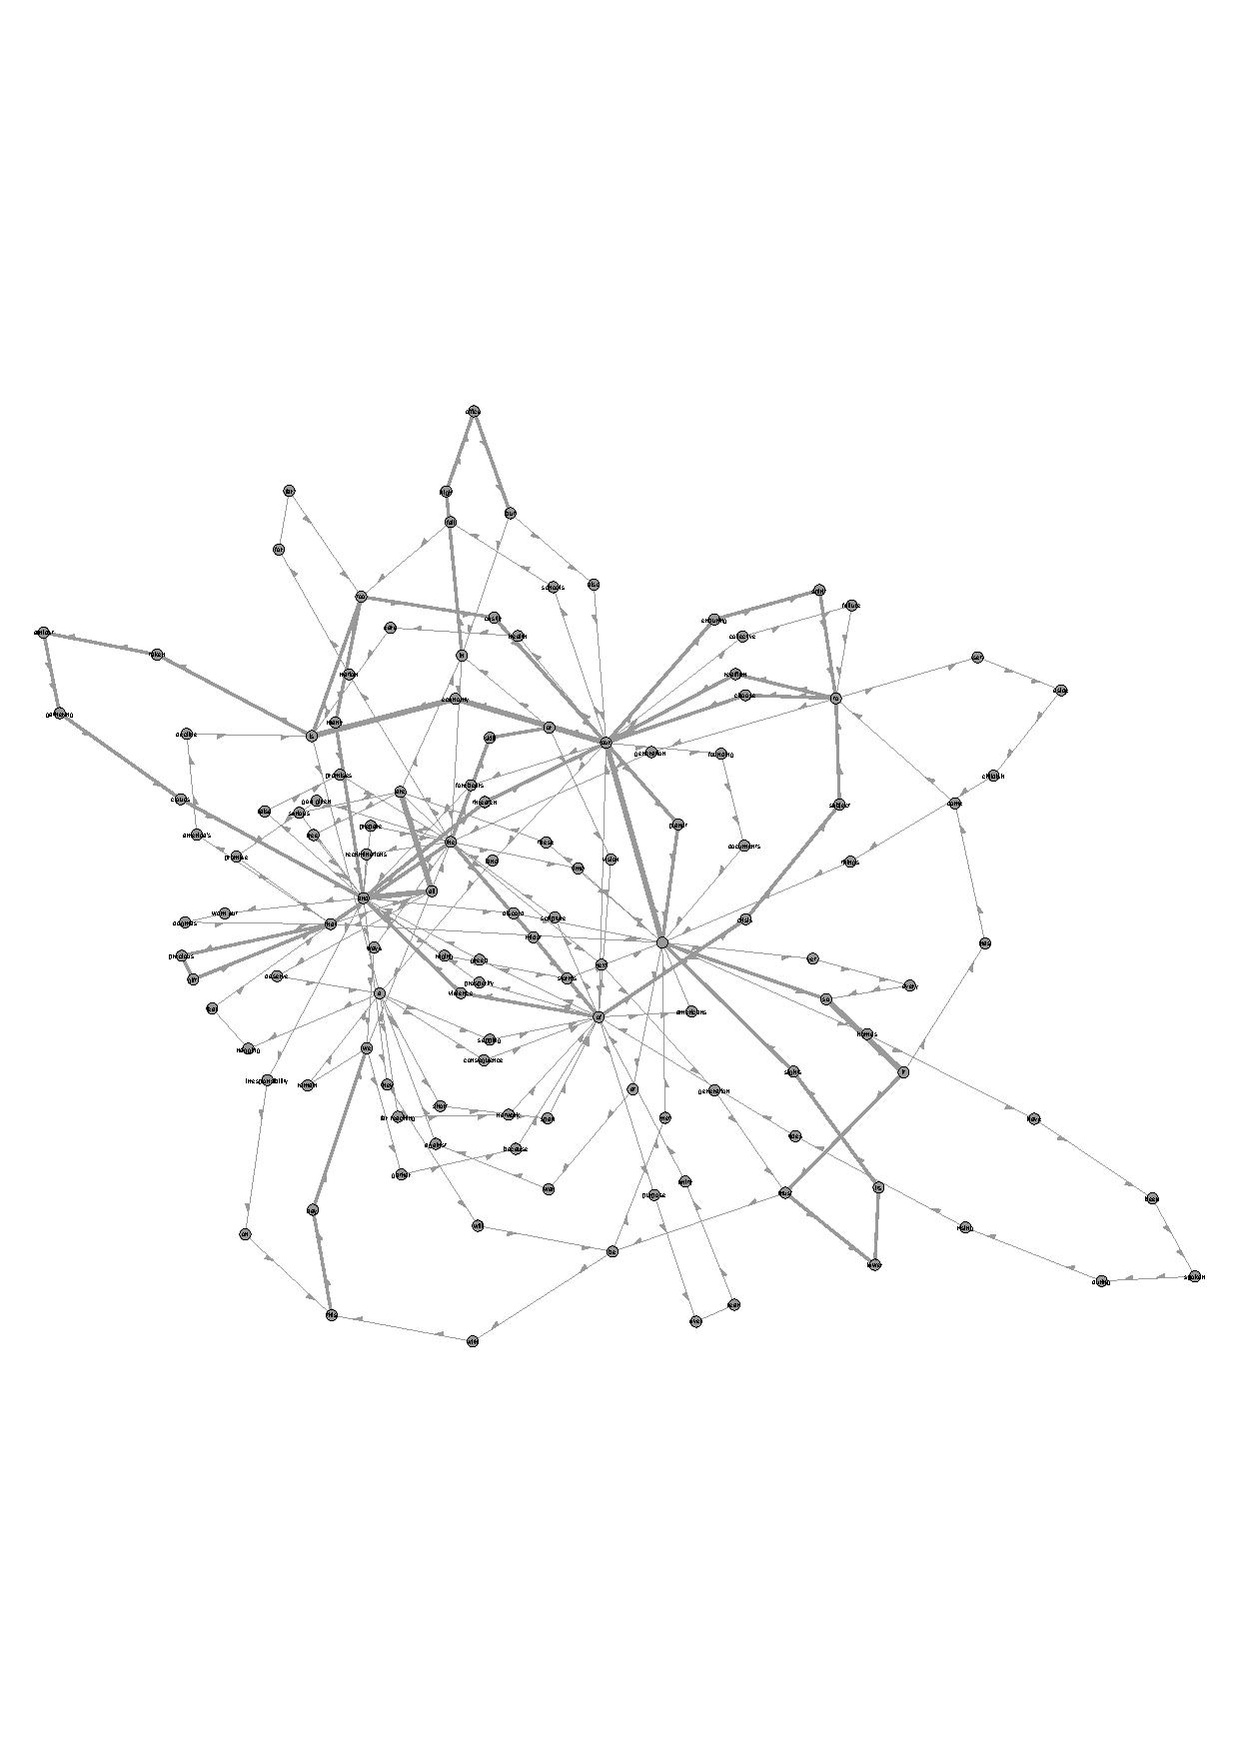
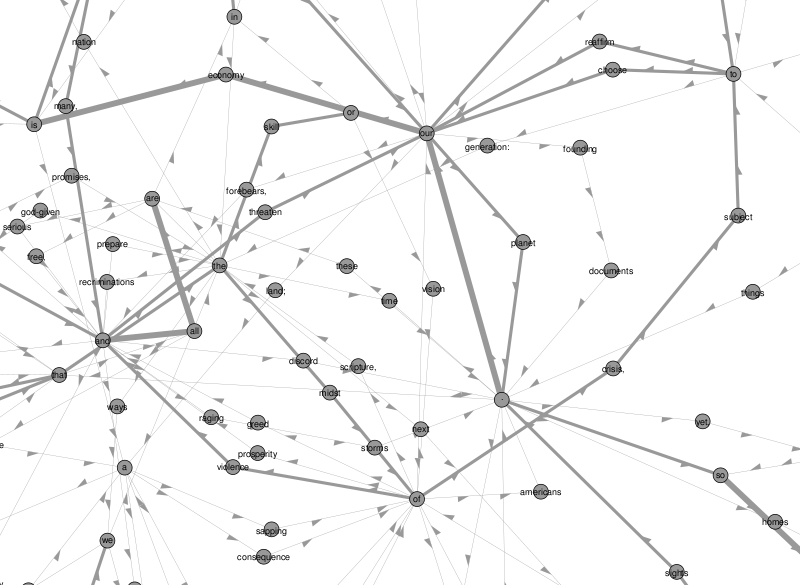
Ex2 : using Obama's inaugural speech
Using the remix from Obama's speech (here)
Soft stuff
This generates the file to throw into Gephi
import random

text = 'They ate the cat before he saw the potato.He knew it.I saw him.'
text = text.replace('.',' . ').lower()
words = text.split()
d = {}
sents = text.split('.')

data = '<?xml version="1.0" encoding="UTF-8"?>\n<gexf xmlns="http://www.gexf.net/1.2draft" version="1.2">\n    <meta lastmodifieddate="2009-03-20">  \n      <creator>lolo</creator>  \n      <description>markov chains</description>    </meta>  \n  <graph mode="static">'

c = 0

data = data + '<nodes>\n'
for w in words:
	if w not in d:
		d[w] = c
		data = data + '<node id="'+str (c)+'" label="'+str (w)+'" />\n'
		c=c+1
data = data + '</nodes>\n'

data = data + '<edges>\n'
e = 0
for w in words:
	if e<len(words)-1:
		data = data + '<edge id="'+str (e)+'" source="'+str (d[words[e]])+'" target="'+str (d[words[e+1]])+'" />\n'
		e = e+1
data = data + '</edges>\n'

data = data + '</graph>\n</gexf>\n'

f = open('mc.gexf','w');
f.write(data)
f.close()
Specifically, this :
<?xml version="1.0" encoding="UTF-8"?>
<gexf xmlns="http://www.gexf.net/1.2draft" version="1.2">
    <meta lastmodifieddate="2009-03-20">
      <creator>lolo</creator>
      <description>markov chains</description>    </meta>
  <graph mode="static"><nodes>
<node id="0" label="they" />
<node id="1" label="ate" />
<node id="2" label="the" />
<node id="3" label="cat" />
<node id="4" label="before" />
<node id="5" label="he" />
<node id="6" label="saw" />
<node id="7" label="potato" />
<node id="8" label="." />
<node id="9" label="knew" />
<node id="10" label="it" />
<node id="11" label="i" />
<node id="12" label="him" />
</nodes>
<edges>
<edge id="0" source="0" target="1" />
<edge id="1" source="1" target="2" />
<edge id="2" source="2" target="3" />
<edge id="3" source="3" target="4" />
<edge id="4" source="4" target="5" />
<edge id="5" source="5" target="6" />
<edge id="6" source="6" target="2" />
<edge id="7" source="2" target="7" />
<edge id="8" source="7" target="8" />
<edge id="9" source="8" target="5" />
<edge id="10" source="5" target="9" />
<edge id="11" source="9" target="10" />
<edge id="12" source="10" target="8" />
<edge id="13" source="8" target="11" />
<edge id="14" source="11" target="6" />
<edge id="15" source="6" target="12" />
<edge id="16" source="12" target="8" />
</edges>
</graph>
</gexf>


