Graphviz: Difference between revisions
No edit summary |
No edit summary |
||
| Line 5: | Line 5: | ||
</blockquote> | </blockquote> | ||
* | ==Starting in the middle== | ||
* graphviz gallery https://graphviz.org/gallery/ | |||
* gradient examples https://graphviz.org/Gallery/gradient/ | |||
* dot-to-ascii web editor: https://dot-to-ascii.ggerganov.com/ | * dot-to-ascii web editor: https://dot-to-ascii.ggerganov.com/ | ||
* tardigraph: https://gitlab.constantvzw.org/titipi/Tardigraph (TITiPI with Martino Morandi) | |||
* graphs in the Aesthetic Programming book made with graphviz: https://aesthetic-programming.net/ (OSP, Winnie Soon, Geoff Cox) | * graphs in the Aesthetic Programming book made with graphviz: https://aesthetic-programming.net/ (OSP, Winnie Soon, Geoff Cox) | ||
* OSP workshop at Karlsruhe with etherdot: http://osp.kitchen/workshop/karlsruhe/ (June 2023) | * OSP workshop at Karlsruhe with etherdot: http://osp.kitchen/workshop/karlsruhe/ (June 2023) | ||
* [[PythonGraphviz]] | |||
__TOC__ | |||
==Nodes and edges== | |||
Graphviz works with the dot language, based on '''nodes''' and '''edges'''. You can change the type, color and behavior of these with '''attributes''' and '''shapes''': | |||
* [https://graphviz.org/docs/nodes/ nodes attributes] | |||
* [https://graphviz.org/doc/info/shapes.html node shapes] | |||
* [https://graphviz.org/docs/edges/ edge attributes] | |||
This page lists a range of examples: https://renenyffenegger.ch/notes/tools/Graphviz/examples/index | |||
==Layout engines== | |||
Graphviz comes with a set of different built-in '''layout engines''' and each of these render the graph differently: | |||
* '''dot''': hierarchical | |||
* '''neato''': spring | |||
* '''circo''': circular | |||
* '''twopi''': radial | |||
* '''fdp''': force-directed placement | |||
Each of these are installed when you install graphviz. To use them, you change use the name of the layout engine as command in the CLI: | |||
$ dot hello.dot -Tsvg -ofile hello.svg | |||
$ neato hello.dot -Tsvg -ofile hello.svg | |||
$ circo hello.dot -Tsvg -ofile hello.svg | |||
$ twopi hello.dot -Tsvg -ofile hello.svg | |||
$ fdp hello.dot -Tsvg -ofile hello.svg | |||
You can check them all here: https://graphviz.org/docs/layouts/ | |||
==Output formats== | |||
Graphviz uses a range of output formats, such as: | |||
* svg | |||
* png | |||
* jpeg | |||
* pdf | |||
To change the output format, you change the <code>-Tsvg</code> part of your command: | |||
$ dot hello.dot -Tsvg -ofile hello.svg | |||
$ dot hello.dot -Tpng -ofile hello.svg | |||
$ dot hello.dot -Tjpg -ofile hello.svg | |||
$ dot hello.dot -Tpdf -ofile hello.svg | |||
There is a list here: https://graphviz.org/docs/outputs/ | |||
What is nice when you export to '''svg''' is that you can use graphviz as an initial step in your workflow, and continue working on your diagram in other vector editing software, such as [[Inkscape]] or others. And! when saving as svg, your diagram stays a vector drawing, which also means you scale it, copy/paste it into a web page, and... pen plot it! | |||
And about '''png''': this is a good image file format if you want to render your diagram as a static image file, as it good for detailed line drawings and typography, and it support transparency. | |||
==dot language== | ==dot language== | ||
Some examples. | |||
You create '''edges''' with an "arrow": <code>-></code>: | |||
<syntaxhighlight lang="dot"> | <syntaxhighlight lang="dot"> | ||
digraph { | digraph { | ||
| Line 19: | Line 81: | ||
[[File:Hello-xpub.dot.png]] | [[File:Hello-xpub.dot.png]] | ||
You can use '''id's''' to assign attributes to a node: | |||
<syntaxhighlight lang="dot"> | <syntaxhighlight lang="dot"> | ||
| Line 36: | Line 101: | ||
[[File:Hello.dot.png]] | [[File:Hello.dot.png]] | ||
You can use '''subgraphs''' to create multiple edges in one go: | |||
<syntaxhighlight lang="dot"> | |||
digraph { | |||
hello -> {XPUB1 XPUB2} | |||
} | |||
</syntaxhighlight> | |||
[[File:Hello2.dot.png]] | |||
And you can use '''attributes''' to render your diagram in a specific way/color/font/size/...: | |||
<syntaxhighlight lang="dot"> | |||
digraph { | |||
/* set graph attributes here */ | |||
bgcolor="yellow:pink" | |||
gradientangle=90 | |||
* | /* set node attributes here */ | ||
A [label="hello" style=filled color=blue fillcolor="lightgreen:lightyellow" gradientangle=0] | |||
B [label="xpub" style=filled] | |||
/* set edge attributes here */ | |||
A -> B [color=purple] | |||
} | |||
</syntaxhighlight> | |||
[[File:Hello3.dot.png]] | |||
[[Category:Cookbook]] | [[Category:Cookbook]] | ||
Revision as of 11:13, 30 September 2024
Graphviz is open source graph visualization software. Graph visualization is a way of representing structural information as diagrams of abstract graphs and networks. It has important applications in networking, bioinformatics, software engineering, database and web design, machine learning, and in visual interfaces for other technical domains.
Starting in the middle
- graphviz gallery https://graphviz.org/gallery/
- gradient examples https://graphviz.org/Gallery/gradient/
- dot-to-ascii web editor: https://dot-to-ascii.ggerganov.com/
- tardigraph: https://gitlab.constantvzw.org/titipi/Tardigraph (TITiPI with Martino Morandi)
- graphs in the Aesthetic Programming book made with graphviz: https://aesthetic-programming.net/ (OSP, Winnie Soon, Geoff Cox)
- OSP workshop at Karlsruhe with etherdot: http://osp.kitchen/workshop/karlsruhe/ (June 2023)
- PythonGraphviz
Nodes and edges
Graphviz works with the dot language, based on nodes and edges. You can change the type, color and behavior of these with attributes and shapes:
This page lists a range of examples: https://renenyffenegger.ch/notes/tools/Graphviz/examples/index
Layout engines
Graphviz comes with a set of different built-in layout engines and each of these render the graph differently:
- dot: hierarchical
- neato: spring
- circo: circular
- twopi: radial
- fdp: force-directed placement
Each of these are installed when you install graphviz. To use them, you change use the name of the layout engine as command in the CLI:
$ dot hello.dot -Tsvg -ofile hello.svg
$ neato hello.dot -Tsvg -ofile hello.svg
$ circo hello.dot -Tsvg -ofile hello.svg
$ twopi hello.dot -Tsvg -ofile hello.svg
$ fdp hello.dot -Tsvg -ofile hello.svg
You can check them all here: https://graphviz.org/docs/layouts/
Output formats
Graphviz uses a range of output formats, such as:
- svg
- png
- jpeg
To change the output format, you change the -Tsvg part of your command:
$ dot hello.dot -Tsvg -ofile hello.svg
$ dot hello.dot -Tpng -ofile hello.svg
$ dot hello.dot -Tjpg -ofile hello.svg
$ dot hello.dot -Tpdf -ofile hello.svg
There is a list here: https://graphviz.org/docs/outputs/
What is nice when you export to svg is that you can use graphviz as an initial step in your workflow, and continue working on your diagram in other vector editing software, such as Inkscape or others. And! when saving as svg, your diagram stays a vector drawing, which also means you scale it, copy/paste it into a web page, and... pen plot it!
And about png: this is a good image file format if you want to render your diagram as a static image file, as it good for detailed line drawings and typography, and it support transparency.
dot language
Some examples.
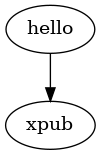
You create edges with an "arrow": ->:
digraph {
  hello -> xpub
}
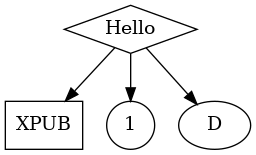
You can use id's to assign attributes to a node:
digraph {

  A [label="Hello" shape=diamond]
  B [label="XPUB" shape=box]
  C [label="1" shape=circle]

  A -> B
  A -> C
  A -> D

}
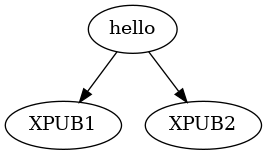
You can use subgraphs to create multiple edges in one go:
digraph {

  hello -> {XPUB1 XPUB2}

}
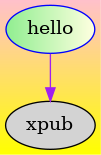
And you can use attributes to render your diagram in a specific way/color/font/size/...:
digraph {

  /* set graph attributes here */
  bgcolor="yellow:pink"
  gradientangle=90

  /* set node attributes here */
  A [label="hello" style=filled color=blue fillcolor="lightgreen:lightyellow" gradientangle=0]
  B [label="xpub" style=filled]

  /* set edge attributes here */
  A -> B [color=purple]

}


