User:Zpalomagar/FIRST CHAPTER/DRAFT: Difference between revisions
Zpalomagar (talk | contribs) |
Zpalomagar (talk | contribs) |
||
| Line 1: | Line 1: | ||
=FUNDAMENTS OF COUNTER-CARTOGRAPHIES= | =FUNDAMENTS OF COUNTER-CARTOGRAPHIES= | ||
<div style='max-width: | <div style='max-width: 50%; margin: 0;'> | ||
Maps are not exact representations of reality even though they are often represented as such. But neither does neutrality exist in the production of maps nor does it exist in their use. They cannot be understood as objective documents but instruments full of intentions, deceptions, narratives ... ( Mesa del Castillo, 2012). In the hands of capitalism and its institutions, mappings have been instrumentalized in many ways (Mesquita, 2016). To revert this power-based culture of map oppression and domination, map-makers have to challenge maps design elements and strategies to develop documents to fight with, to represent modes of resistance and render invisible realities producing counter cartographies. | Maps are not exact representations of reality even though they are often represented as such. But neither does neutrality exist in the production of maps nor does it exist in their use. They cannot be understood as objective documents but instruments full of intentions, deceptions, narratives ... ( Mesa del Castillo, 2012). In the hands of capitalism and its institutions, mappings have been instrumentalized in many ways (Mesquita, 2016). To revert this power-based culture of map oppression and domination, map-makers have to challenge maps design elements and strategies to develop documents to fight with, to represent modes of resistance and render invisible realities producing counter cartographies. | ||
Revision as of 12:55, 11 December 2019
FUNDAMENTS OF COUNTER-CARTOGRAPHIES
Maps are not exact representations of reality even though they are often represented as such. But neither does neutrality exist in the production of maps nor does it exist in their use. They cannot be understood as objective documents but instruments full of intentions, deceptions, narratives ... ( Mesa del Castillo, 2012). In the hands of capitalism and its institutions, mappings have been instrumentalized in many ways (Mesquita, 2016). To revert this power-based culture of map oppression and domination, map-makers have to challenge maps design elements and strategies to develop documents to fight with, to represent modes of resistance and render invisible realities producing counter cartographies.
Counter maps fight geopolitical power structures drawing against official maps while exposing relations of domination over and exploitation of territory as well as revealing networks of power and dominance. Therefore, they do not only represent space but also produce it. (Blázquez, 2018). They create an alternative reality based on graphic representation which implies the creation of new codes and protocols when displaying a territory or society.
Deconstructing cartographic representation, the rule is there are no rules
The experimental map rethinks the ontology of cartography ( *1). Counter-maps break the standards of geographic representation and visual communication. They became disobedient graphic evidence where its own form and representation tells inconvenient stories that challenge the status quo. It’s a free act of deconstruction of space and social phenomena, for which the protagonists allow themselves to pervert the most classic conventions (*2). Counter-cartographies are understood as maps that break the scientific and expertise tradition of cartography as well as with its mere technical or essentially positivist view of the world (Mesquita, 2016). The objective of experimental mapping is to suggest an alternative epistemology, rooted in social theory rather than in scientific positivism (Harley, 1989).
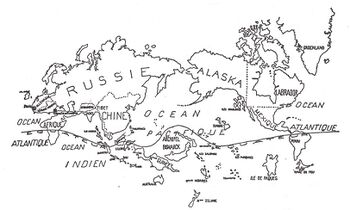
Mapping a territory implies an act of reinterpretation and reflection. Traditionally, the World Map has been represented with a series of pre-established rules and protocols where the north is always up and the ‘official’ projection is Mercator World Map. Nevertheless, the fact that we put north on the top of the map is a result of the economic dominance in Western Europe after 1500. A map does not have a privileged direction in space. After all the earth has no up or down, and no geographical centre. (Turnbull, 1993 in Prater, 2016) (*3). Counter-maps break this traditionalism and challenge geographical representation as an opportunity to spread alternative views of the territory. Remaking this representation means subverting the hegemonic, Eurocentric view of the world (Mesquita, 2016). “Having been labelled ‘colonial’, ‘evil’, and ‘false’, the Mercator map is a monstrosity that just won’t go away.” (Prater, 2016). Every projection of the earth's sphere in flat representations implies a distortion and therefore there is no better representation than another but simply different translation codes. The Surrealist World Map, published in 1929 and America Invertida designed by Joaquin Torres in 1943 are two early examples of the expression of rebellion in geographical representation. In 1876 Lewis Carroll wrote his poem “The Hunting of the Snark” where the usefulness of Mercator map was questioned, determining that the ‘perfect map’ would be an absolute white document. (*4)
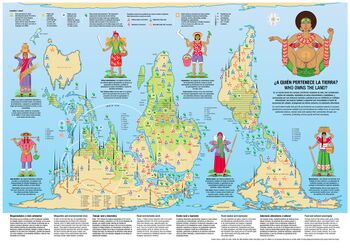
In recent counter-cartographies, world representation has been frequently deconstructed and reinvented. This is the case of the project Who owns the land? developed by Iconoclasistas which amplify the work of autochthonous women. The world map is re-oriented in order to emphasise the power of south hemisphere where most of the indigenous activities are condensed and Mercator projection is replaced for Gall-Peters representation where each area on the map represents an equal area of land to raise awareness about the real dimension of land in southern territories. Another example is the work Mappa Mundi(2008) from Lize Mogel where she reorders the world map based on the connection between places, their histories and processes of globalization.
The geographical variable can be denied in counter-cartographies to amplify social, political or crisis realities. Therefore, counter-maps break the link with scientific and technical representations. They are not query items to check specific information but full communicational document themselves. The Polish-American scholar Alfred Korzybsky promulgate in his best-known dictum “The map is not the territory”. Counter-maps are not a representation of territory but the document that generate alternative realities and produce new spaces. (*5). They are a dialogue between the imaginary and the real world because the map is never a faithful representation of reality even if cartographers and geographers claim the opposite, the map is a pale representation of the way we perceive the world. (*6)
The figure of the cartographer as the main axis of map-making is dissolved in the creation of counter-cartographies. The duality between the contribution of the cartographer and the receiver have a decisive role in counter-mapping. In the 70s the Czech geographer A. Kolácny (*6), established the bases on which the maps were no longer understood as information display to become a communication system that requires its own narrative rules and rhetorical figures (Mesa del Castillo, 2012). The ubiquity of graphical formats calls for a new critical understanding of the ways we read and process visual information (Drucker, 2014). Like reading a graphic novel, The main goal of literary cartography, as synthesized by Moretti (1999), is to rearrange the components of a narrative in an unexpected way in order to bring to the surface hidden configurations.
Radical maps challenge the traditional cartographic storytelling exploring non-linear and experimental readings. In Die neue Typographie (The New Typography, 1928), the graphic designer Jan Tschichold observed that “as a rule, we no longer read quietly line by line, but glance quickly over the whole, and if our interest is awakened do we study in detail.” ( Vossoughian, 2011) The modern man needs speculative and experimental narratives (*7) to engage with and to process visual information in a world where we receive pictorial impressions in an amount that was unthinkable in any previous moment in history. Deconstruction of conventionalism urge us to read between the lines of the map (Harley, 1989). There are no more boxes into boxes and hierarchical structures but a door open to alternative reading. “A good map stimulates the imaginations of users who invent road trips, battles, and love stories as they follow the long spindly highway lines and pools of blue water” ( Berwick, 2010).Maps never need to be considered finished, the reader closes the circle of production. (*8).
Visual democracy, filling gaps of misrepresentation
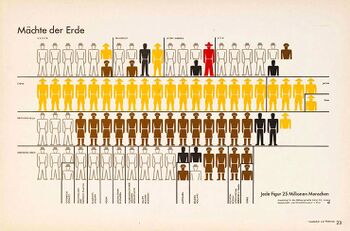
Visual language is a mechanism to popularise information and make it accessible to people disentangling complex phenomenon into readable documents. Images are produced and consumed in our current culture in quantities that would have been unthinkable in any previous period in human history (Drucker, 2014). Therefore, creating fair and democratic visual languages is an essential point in communication to engage with communities. The philosopher and sociologist Otto Neurath (*1) created in the XX century the Isotypes that would be a premature introduction to the pictographic language. This system made data legible and accessible to non-specialised mass audiences ( Vossoughian, 2010:61). Its role was decisive in order to raise awareness about the Second World War. Furthermore, he created the Museum of War Economy and the Museum of Society and Economy in order to amplify information about political and social realities during the war period. He was a pioneer in the reinterpretation of graphic representation creation both, the space to share it with people and the proper codes to express this knowledge. The German pioneer Fritz Kahn also worked in the demystification of complex scientific ideas through an innovative infographic grammar. The creation of a visual language that allows to amplify and communicate a complex reality is crucial in counter maps that transform this information that is concealed, buried in government tables and footnotes or is just nonexistent into accessible information.
Graphic communication has had a Western supremacy evolution in the last decades. Isotypes were an invention during the time of European colonialism. Only then it becomes clear that the rhetoric of Isotype as ‘objective’ and ‘neutral’ simply meant they represented European colonial standards. In the visual examples non-European countries are grouped and categorised as ‘other’ (Prater, 2016). There are an emergency to fill visual gaps in order to represent democratic realities. Since we inhabit a world permeated by digital technology, we will address the urgency of finding critical languages for the graphics that predominate in the networked environment: information graphics, interface, and other schematic formats (*2) (Drucker, 2014). Counter maps envision misrepresented and vulnerable realities and communities which implies to rethink the visual representation in order to render imperceptible realities through egalitarian graphic language. The reinvention of new visual grammars implies progress towards a more democratic design. In the world of signing it is always 1974, the year when the symbols were designed for the U.S Department of Transportation (DOT) ( Prater, 2016) We need an adaptive design that represents the current problems with contemporary visual systems that challenge traditionalisms and standardisation.
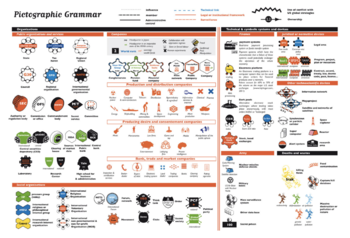
In the recent production of counter cartographies, contemporary visual languages have been created. This is the case of the French office Bureau d’Études that generated for their book Atlas of Agendas a specific pictographic grammar in order to visualise political and social concepts and make them accessible and understandable for people creating a is a codification of visual language, decompressing complexities that they process and recoding it again with a new graphic interpretation. Moreover, the Argentinian duo Iconoclasistas have been working in the last years in the improvement of pictographic grammars building dynamic pictographic collections for community mapping in South América. (*3)
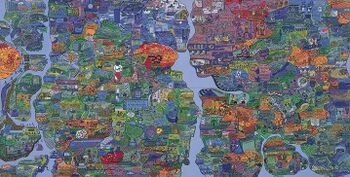
The mathematician Rene Thom stated that Visual codes are notoriously unstable, too imprecise to communicate knowledge with certainty (Drucker, 2014). But this instability of graphic codes makes them open and free to reinvent and this is precisely what makes them so powerful in the representation of counter-maps. Visual images are not constructed in a given set of rules (Drucker, 2014) not having rules and protocols to follow, allow map-makers to create the proper and unique grammar for a particular document, converting it not just in a communicational element but in identity and personality of a community. In the project The Hidden Object Map Right to the City, Marc Amann and Markus Wende (*4) they develop a cartoon map displaying protect actions and they describe the project as a document that represents fiction just as it represents the truth. It is an interpretative language that transmits innumerable stories rather than quantitative information (*5) because there is no such thing as emotionless cartography. (*6)
The dissolution of barriers between the reader and the map-maker in the production of radical maps is also an act of democratisation of cartographic production. Communities are frequently deeply integrated into the process of map-making. This means that people who are mapped have the power to design their visual language and strategies. This self-representation of communities created a dynamic and sensitive grammar that not only creates a graphic representation but also leave footprints in maps. (*7)
Cartographic hybridization
Experimental practices in map-making were born in the intersection between several disciplines working together in the production of cartographic content. Counter-cartographies expand the disciplines that are present in map-making opening a door to build a hybrid and inclusive practice. They revert the nature of cartographic representation and it also implies fight against monopolistic control of cartographies. The challenge for counter-cartographers is to find a multidisciplinary space to work between psychology, geography, architecture, art, design, politics and sociology. Mapping impulses result from a convergence of a number of shifts in the way we think about representation and space. (Mogel, 2010)
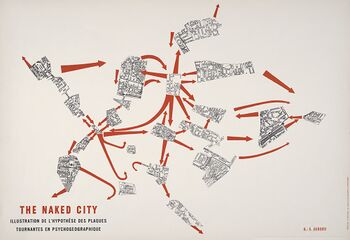
In 1955 French theorist Guy Devon introduce the term psychogeography as the intersection of psychology and geography, understanding the representation of the territory as a phenomenon based on perceptions and emotions of people perceiving urban space, this situationist maps were making cartographies for themselves maximising the experiences that a person have when is walking without a destiny in the city. They challenge the traditional map-making and produced a series of alternative representations based on perception and not in a preset group of rules and protocols.
Since Avant-Garde and Dadaism and Surrealist movements, cartographic culture and art have been strongly connected as an area of communication exploration through maps. The British Cartographic Society proposed that there should be two definitions of cartography, "one for professional cartographers and the other for the public at large." A definition "for use in communication with the general public" would be "Cartography is the art, science and technology of making maps": that for 'practising cartographers' would be "Cartography is the science and technology of analyzing and interpreting geographic relationships, and communicating the results by means of maps." (Harley, 1989). The word art disappears when the definition refers to scientific or technical approaches but it is an indispensable element when cartographies are used as elements to engage with people.
Counter-maps and art are strongly related in contemporary practices, the publication An Atlas of radical cartographies edited by Lize Mogel and Alexis Bhagat has been exposed in numerous museums and galleries all over the world where its counter cartographies have become aesthetics objects to contemplate and these art spaces have been used as network to amplify and spread revolutionary and revealing information.
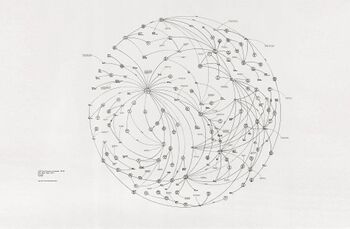
The transformation of cartography by practices of art activism over the past decades has made it possible to explore alternative models outside of the academic context and beyond purely scientific activities (Mesquita, 2016). Öyvind Fahlström and Mark Lombardi are undoubtedly precursors for today’s activism in the art using maps. Fahlström used methods from popular culture to critique and question cultural assumptions about finance, power structures and their representations. (Watson, 2009). In 1972 he published the World map, this work challenges the austerity in maps and visualises the instability of imperial power disputed between the United States and the Soviet Union. The activist nature of counter cartographies allows rendering an alternative reality that amplifies misrepresented phenomenon and invisible realities. They transmit the message: ‘This is the world you live in even though you may not see this.'(Berwick, 2010). The Americal Neo-conceptual artist Mark Lombardi also challenge the process of map-making melting it with artistic and activistic practices. He draws hundreds of diagrams that visualised global political and economic networks.
Maps and diagrams that visualise information constitute a political device (Mesa del Castillo, 2012) The traditional cartography ignores the political and social use of the map, and its role as both reaction and contestation(*4.1) but they are an effective mechanism to activate political agency within society. Counter-cartographies are documents that make politics in themselves through geospatial and technological approaches. Its social role is to give voice to a vulnerable reality and direct a community towards potential improvements that achieve quality social conditions.
NOTES
———————
- NO FOOTNOTES BUT NOTES FOR ME
(*1.1) The dictum: “Maps do not only represent space but also produce it” is extracted from the article: Counter Cartographies in Palestine by Olga Blázquez Sanchez.
———————
( *2.1) “The experimental map can rethink the ontology of cartography” is an extract from an interview with the French Office Bureau D’Études in the book Diagrams of Power.
(*2.2) “It’s a free act of deconstruction of space and social phenomena, for which the protagonists allow themselves to pervert the most classic conventions” is an extract from an interview with Philippe Rekacewicz in the boon Diagrams of Power.
(*2.3) Stuard McArthur, was the fist person who published in 1979 the first sur-up world map, setting Australia en the centre of it to represent his personal reality and to revert the conventionalism that Australia was always a corner in the World cartographical representation.
(*2.4) “What’s the good of Mercator’s North Poles and Equators,
Tropics, Zones, and Meridian Lines?”
So the Bellman would cry: and the crew would reply
“They are merely conventional signs!
The Hunting of the Snark (Lewis Carrol)
(*2.5) This is based on the interview The authoritative voice (totalitarian view) of an invisible system with Bureau d’Études in the book Diagrams of Power.
(*2.6) The cartographic model from Kolacny was particularly complex because it considered the contribution from cartographer and user. (Mesa del Castillo, 2012:167)
(*2.7) In Vienna museum XXXXXX the artwork is no longer classified, no more logical order ( Diagrams of power) ****CHECK!!!!
(*2.8) The viewer is smart enough to co-produce the narrative. Olafur Eliasson (Check !!!!)
———————
(*3.1) Otto Neurath work with the German artist Gerd Arntz for the production of Isotypes and Museums of War economy.
(*3.2) Semiology of Graphics: Diagrams, Networks, Maps - Jaques Bertin.
(*3.3) Literal evolution of Isotypes to contemporary realities.
(*3.4) Recht auf Stadt! - https://wimmelbild.animationsfilm.de/recht-auf-stadt/
(*3.5) “Stop counting and start talking with the inhabitants of a place” - From the Map to the ground and back ( This is not an Atlas)
(*3.6)As data Journalist Mona Chalabi posits, there is no such thing as emotionless data visualisation. Chalabi argues, “It’s important that the visualisation itself reflects the subject matter and not just the numbers.” Having 449 individual marks represents the subject matter and not just the number.
(*3.7) Examples of self-production grammar: From the Map to the Ground and Back?
———————
(*4.1)The traditional cartography ignores the political and social use of the map and its role as both propaganda and contestation (Philippe Rekacewicz- Diagrams of power)

