User:Bohye Woo/labour experiment: Difference between revisions
| Line 208: | Line 208: | ||
===Step 4: Writing into a new style of Javascript=== | ===Step 4: Writing into a new style of Javascript=== | ||
Problem of this way of coding is that they're stretched. | I loaded different JSON files every time. What is interesting to see is to see the whole timeline of my labour. Problem of this way of coding is that they're stretched and not in a same scale. | ||
To make them in a same timeline, I need to find total minimum and maximam. Therefore I re-write with a new style of Javascript that allows you to write linearly. | |||
*Promises | |||
The Promise object represents the eventual completion (or failure) of an asynchronous operation, and its resulting value. instead of immediately returning the final value, the asynchronous method returns a promise to supply the value at some point in the future. | |||
*Async | *Async | ||
Async is a utility module which provides straight-forward, powerful functions for working with asynchronous JavaScript. | Async is a utility module which provides straight-forward, powerful functions for working with asynchronous JavaScript. | ||
*Await | |||
The await operator is used to wait for a Promise. | |||
I need to load everything at the same time to see the whole labour I produced. | I need to load everything at the same time to see the whole labour I produced. | ||
Revision as of 12:50, 2 October 2019
Labour investigation in social media
This is a small prototyping with my personal data created from Facebook and Instagram. I call this experiment as a 'crime scene case' in which I will make an investigation report, it might lead me to start on a new study case. By downloading my personal datas I produced, I would like to delve into investigate what kinds of data I have produced, To create this data what labour is being used, how many time I worked to create them. I will visualize them to see the possibilities of materializing the labour.
Step 1: Extracting && Analyzing my data
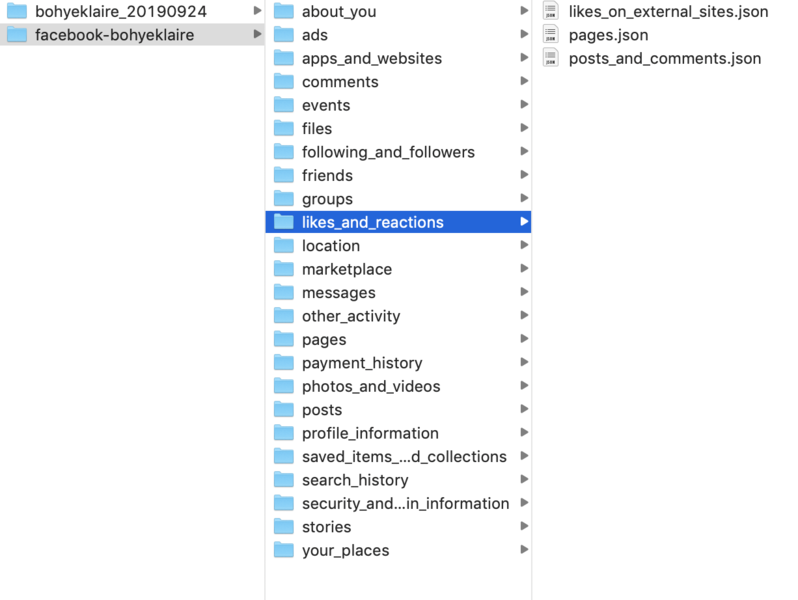
What data has been collected? I've collected my 9 years of social media experience in JSON file.
A JSON file that collected my likes on posts
{
  "reactions": [
    {
      "timestamp": 1569322034,
      "data": [
        {
          "reaction": {
            "reaction": "LIKE",
            "actor": "Bo Woopsie"
          }
        }
      ],
      "title": "Bo Woopsie likes Roosje Klap's post."
    },
    {
      "timestamp": 1568990971,
      "data": [
        {
          "reaction": {
            "reaction": "LIKE",
            "actor": "Bo Woopsie"
          }
        }
      ],
      "title": "Bo Woopsie likes Shinyoung Kim's photo."
    },
    {
      "timestamp": 1568757503,
      "data": [
        {
          "reaction": {
            "reaction": "LIKE",
            "actor": "Bo Woopsie"
          }
        }
      ],
      "title": "Bo Woopsie likes Cramer Florian's album: Public Library | Latag."
    },
    {
      "timestamp": 1567672802,
      "data": [
        {
          "reaction": {
            "reaction": "LIKE",
            "actor": "Bo Woopsie"
          }
        }
      ],
      "title": "Bo Woopsie likes Michel Hoogervorst's photo."
    },
]
}
Step 2: Visualizing my labour
<!DOCTYPE html>
<html>
	<head>
		<meta charset="utf-8">
		<title>Let's publish our labour</title>

		<style type="text/css">
			svg {
				border: 1px solid gray;
			}
			circle.item {
				fill: green;
			}

		</style>
	</head>

	<body>
		<div id="content"></div>
		<svg id="graph" width=5000 height=100></svg>
	</body>

	<script src="d3/d3.min.js"></script>
	<script type="text/javascript">

		d3.json ("posts_and_comments.json").then(data => {
			console.log("data", data)

			let start = d3.min(data.reactions, d=>d.timestamp),
				end = d3.max(data.reactions, d=>d.timestamp);
			console.log("min", start, "max", end);

			let	pos = d3.scaleLinear().domain([start, end]).range([0, 5000]);
			window.pos = pos;

			d3.select("#graph")
				.selectAll(".item")
				.data(data.reactions)
				.enter()
				.append("circle")
				.attr("cx", d => pos(d.timestamp))
				.attr("cy", 10)
				.attr("r", 2)
				.attr("class", "item")
				.append("title")
				.text(d => d.title);
				//same as: .text(function(d) { return d.title });
		})

	</script>
</html>
Step 3: Adding more datas to compare different datas
Added 'other_peoples_posts_to_your_timeline.json' & 'likes_on_external_sites.json'
<script type="text/javascript">
	d3.json ("posts_and_comments.json").then(data => {
		console.log("data", data)


		let start = d3.min(data.reactions, d=>d.timestamp),
			end = d3.max(data.reactions, d=>d.timestamp);
		console.log("min", start, "max", end);

		let	pos = d3.scaleLinear().domain([start, end]).range([0, 5000]);
		window.pos = pos;

		d3.select("#graph")
			.selectAll(".item")
			.data(data.reactions)
			.enter()
			.append("rect")
			.attr("x", d => pos(d.timestamp))
			.attr("y", 0)
			.attr("width", 2)
			.attr("height", 2)
			.attr("class", "item")
			.append("title")
			.text(d => d.title)
			//same as: .text(function(d) { return d.title });
	})


	d3.json ("likes_on_external_sites.json").then(data => {
		console.log("data", data)

		let start = d3.min(data.other_likes, d=>d.timestamp),
			end = d3.max(data.other_likes, d=>d.timestamp);
		console.log("min", start, "max", end);

		let	pos = d3.scaleLinear().domain([start, end]).range([0, 5000]);
		window.pos = pos;

		d3.select("#graph")
			.selectAll(".item2")
			.data(data.other_likes)
			.enter()
			.append("circle")
			.attr("cx", d => pos(d.timestamp))
			.attr("cy", 10)
			.attr("r", 2)
			.attr("class", "item2")
			.append("title")
			.text(d => d.title);
	})


	d3.json ("other_peoples_posts_to_your_timeline.json").then(data => {
		data = data.wall_posts_sent_to_you
		console.log("data3", data)

		let start = d3.min(data.activity_log_data, d=>d.timestamp),
			end = d3.max(data.activity_log_data, d=>d.timestamp);
		console.log("min", start, "max", end);

		let	pos = d3.scaleLinear().domain([start, end]).range([0, 5000]);
		window.pos = pos;

		d3.select("#graph")
			.selectAll(".item3")
			.data(data.activity_log_data)
			.enter()
			.append("circle")
			.attr("cx", d => pos(d.timestamp))
			.attr("cy", 15)
			.attr("r", 2)
			.attr("class", "item3")
			.append("title")
			.text(d => d.title);
	})
</script>
I loaded different JSON files every time. What is interesting to see is to see the whole timeline of my labour. But the problem is that they're not in a same scale. Therefore I need to find total minimum and maximam to make a timeline.
Step 4: Writing into a new style of Javascript
I loaded different JSON files every time. What is interesting to see is to see the whole timeline of my labour. Problem of this way of coding is that they're stretched and not in a same scale. To make them in a same timeline, I need to find total minimum and maximam. Therefore I re-write with a new style of Javascript that allows you to write linearly.
- Promises
The Promise object represents the eventual completion (or failure) of an asynchronous operation, and its resulting value. instead of immediately returning the final value, the asynchronous method returns a promise to supply the value at some point in the future.
- Async
Async is a utility module which provides straight-forward, powerful functions for working with asynchronous JavaScript.
- Await
The await operator is used to wait for a Promise.
I need to load everything at the same time to see the whole labour I produced.
Promises and Legend — D3
=Legend
I loaded different JSON files every time. And the problem is that they're not in a same scale. So I need to find total minimum and maximam to What is interesting to see is to see the whole timeline of my labour.


