Pen plotters/zine: Difference between revisions
(Created page with "{{ :Pen plotters }}") |
No edit summary |
||
| (One intermediate revision by the same user not shown) | |||
| Line 1: | Line 1: | ||
{{ :Pen plotters }} | {{ :Pen plotters }} | ||
==Prototypes, tryouts, projects, gallery== | |||
===Plotting volume levels=== | |||
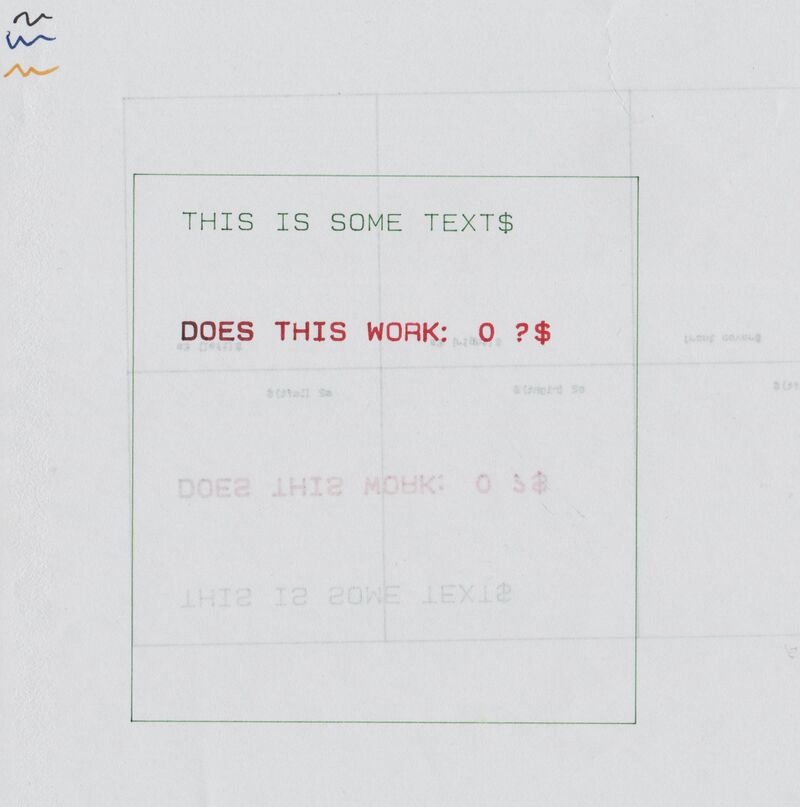
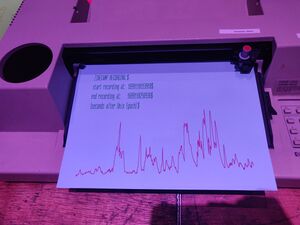
At Machinecamp, an event accompanying zinecamp, Victor and Thijs gave mini penplotter workshops to visitors. During the event, they wrote some javascript code to capture ~2 minutes of audio and translate the volume levels to HPGL. This was then sent to a plotter. | |||
It is available with a web interface as part of the SI23 quilt. | |||
{{ :User:Thijshijsijsjss/Pen_Plotting_Panache/Volume_Plotting }} | |||
==Complot== | |||
{{ :User:ØverLørd/Complot }} | |||
==Crosshatching experiments== | |||
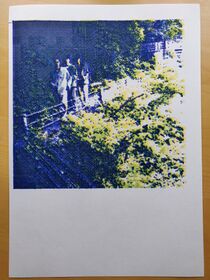
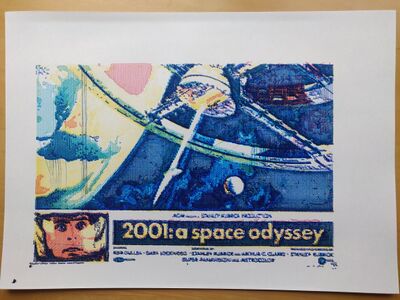
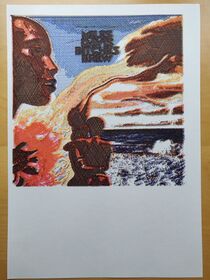
Inspired by https://hackaday.io/project/20585-upgrade-for-your-diy-plotters, Victor and Thijs wanted to do some crosshatched plots. They wrote a processing script to convert images to crosshatched versions. By doing this for any image's different CMYK color channels separately, it is possible to create intricate multicolor plots. | |||
A workflow for this technique can be found here: here | |||
[EXAMPLES WILL BE ADDED LATER TODAY :)] | |||
{{ :Plothatching }} | |||
Latest revision as of 15:59, 6 February 2024
Pen plotting at XPUB
Plotters at XPUB
HP DraftPro EXL
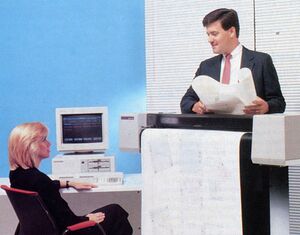
A0+ pen plotter.
Currently borrowed from Varia, who borrows it from Gijs (OSP).
http://hpmuseum.net/display_item.php?hw=393
- state: works
- attitude: this plotter needs to have paper loaded before you start chiplotle; the center point lies at the right bottom of the paper, it works with negative numbers;
- demo plot: press
P1 + P2simultaneously (the buttons with a small 1 and 2) - user manual: http://www.hpmuseum.net/document.php?hwfile=3232 + http://www.hpmuseum.net/collection_document.php (list of HP museum user manuals, in case the download link above does not work)
- language: HPGL (HP graphics language)
HP 7550A
A4 pen plotter
Old plotter from publication station. Need a new fuse and is working again.
HP 7475A
A4/A3 plotter
https://www.hpmuseum.net/display_item.php?hw=74
- demo plot: hold down the
P1 + P2keys and turn on the power - user manual: https://archive.org/details/HP7475AInterfacingandProgrammingManual
There are two of these at XPUB:
xml-plotter-1
- state: works
- repair log: Printing/xml-plotter-1
xml-plotter-5
- state: works
- repair log: Printing/xml-plotter-5
NOTE: had to use this to get a macbook to connect plotter = instantiate_plotters()[0]
HP ColorPro
A4 plotter
http://hpmuseum.net/display_item.php?hw=80
- state: unknown
HP 7440A
A4 plotter
This plotter works with 230v, but it needs a special power supply (0v - 10v - 20v) - info in the hp museum
- user manual: https://userequip.com/files/specs/1504/HP%207440A%20Operating.pdf
- in the HP museum: http://hpmuseum.net/display_item.php?hw=80
- status: works with a parallel port, and is currently connected with an adapter to a serial port, connected to another adapter to USB
TAXAN X-Y KPL710
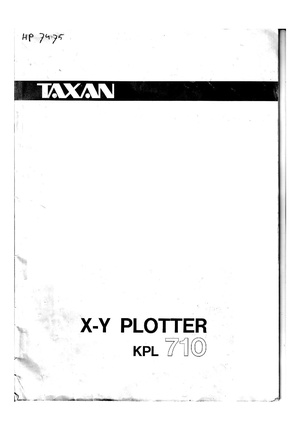
A3 plotter
The plotter was given to Joak by Thomas Walskaar, we're not sure who gave it to him.
- state: works
- user guide: File:Taxan kpl710 x-y plotter.pdf
- repair log: Printing/xml-plotter-3
Dip switch settings:
1   2   3   4  5   6  7  8
OFF OFF OFF ON OFF ON ON ON
BBC Metrawatt SE-283
- repair log: Printing/xml-plotter-2
HP 7550A
A4/A3/A2 plotter, with a paper feeder!
- state: Currently not working, the carousel is missing
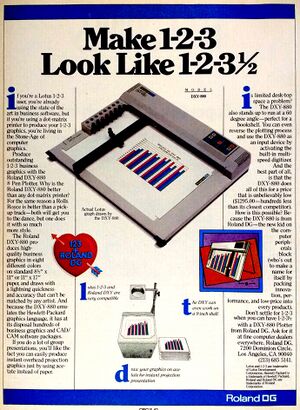
Roland DXY-980
A3 pen plotter
How to pen plot?
HPGL
Hewlett-Packard Graphics Language (HPGL) is a common plotter language that most plotters speak.
You can turn any vector file into a .hpgl file with Inkscape, which is a free software vector editing tool.
More references and links related to HPGL:
- There is a HPGL book in the studio/library!
- HP-GL Reference Guide
- http://paulbourke.net/dataformats/hpgl/
- https://www.isoplotec.co.jp/HPGL/eHPGL.htm
IN;IP0,0,4000,4000;SC0,100,0,100;
SP1;
PA0,0;
PD;
PA100,0;
PA100,100;
PA0,100;
PA0,0;
PU;
CLI
Most plotters connect to this socket on a Linux machine:
/dev/ttyUSB0
Add your user to the dialout group first:
$ useradd USERNAME dialout
Then configure how your computer and the plotter communicate, these settings should work with most plotters:
$ stty 9600 parodd parenb ixon ixoff -F /dev/ttyUSB0
Then send a file with cat:
$ cat myfile.hpgl > /dev/ttyUSB0
Chiplotle
Chiplotle is an HPGL plotter driver that implements and extends the HPGL (Hewlett-Packard Graphics Language) plotter control language. It provides direct control of your HPGL-aware hardware via a standard usb<->serial port interface. Chiplotle is also a general purpose vector drawing library with functions for creating and transforming shapes, which can then be sent directly to your HPGL plotter for printing.
Chiplotle is written and maintained by Víctor Adán and Douglas Repetto.
- Main web page: http://sites.music.columbia.edu/cmc/chiplotle/
- Documentation: https://chiplotle.readthedocs.io/en/latest/index.html
- More documentation: http://sites.music.columbia.edu/cmc/chiplotle/manual/chapters/tutorial/intro.html
Use
Connect to plotter to computer with usb.
Start the plotter.
Wait! until the plotter is fully running.
Activate the venv you made.
In Linux:
$ source FOLDERNAME/bin/activate
In Windows (using Powershell):
$ FOLDERNAME\Scripts\Activate.ps1
Now you can start chiplotle:
$ chiplotle3
It should automatically detect the plotter...
If it doesn't, you can try to turn the plotter on and off, or load paper.
Once the plotter is detected, you can send a HPGL file to plotter:
plotter.write_file('FILENAME.hpgl')
When you're done, close chiplotle with:
exit()
Install
Install pip, venv
First install pip and the virtual environment python module, if you don't have them yet.
On Linux:
$ sudo apt install python3-pip
$ sudo apt install python3-venv
On Mac and Windows:
follow the instructions at https://www.python.org/.
Make a virtual environment
On Linux and Mac:
$ python3 -m venv FOLDERNAME
For example:
$ python3 -m venv plotter-venv
On Windows:
py -m venv FOLDERNAME
For example:
$ py -m venv plotter-venv
Activate the virtual environment
On Linux and Mac:
$ source FOLDERNAME/bin/activate
On Windows (using Powershell):
FOLDERNAME\Scripts\Activate.ps1
You can exit again by writing deactivate.
Install Chiplotle
Install Chiplotle inside this virtual environment (the Python library to speak HPGL to the plotter):
$ pip install Chiplotle3
Run Chiplotle
See #Use.
Errors
Windows: Script Execution Policy
See: https://www.makeuseof.com/enable-script-execution-policy-windows-powershell/
Mac: ImportError: module not found "imp"
?
Windows: "port" not found (?)
File "C:\Users\aless\OneDrive\Desktop\PENPLOTTER_venv\lib\site-packages\serial\serialutil.py", line 268, in port
   raise ValueError('"port" must be None or a string, not {}'.format(type(port)))
ValueError: "port" must be None or a string, not <class 'int'>
Alessia and Manetta spend an hour on this error on Nov 13th 2023, but did not figure it out. There is little documentation on using Chiplotle on Windows unfortunately. A next step could be do open serialutil.py to see if the error can be resolved directly there.
It's the next day now, we looked into this again and solved it!
First, edit your Chiplotle config file, which is stored in your home folder, which you can edit on Linux/Mac with:
$ nano ~/.chiplotle/config.py
or on Windows:
> notepad C:\Users\USERNAME\.chiplotle\config.py
Change this line:
serial_port_to_plotter_map = None
into:
serial_port_to_plotter_map = {'COM4' : 'HP7475A'}
or use another plotter model number.
Secondly, you need to also edit a Python script within the Chiplotle library, which you can open on Linux/Mac with:
$ nano PATH-TO-YOUR-VENV/chiplotle3/src/chiplotle3/plotters/baseplotter.py
or on Windows:
> notepad PATH-TO-YOUR-VENV\chiplotle3\src\chiplotle3\plotters\baseplotter.py
Then edit the following on line 196:
@property
def _buffer_space(self):
    self._serial_port.flushInput()
    self._serial_port.write(self._hpgl.B().format.encode())
    bs = self._read_port()
    return int(bs)
and just change the last line:
@property
def _buffer_space(self):
    self._serial_port.flushInput()
    self._serial_port.write(self._hpgl.B().format.encode())
    bs = self._read_port()
    return int(128)
Now Chiplotle should work.
Raspberry Pi
Numpy error:
libopenblas.so.0: cannot open shared object file: No such file or directory
Install the missing library:
$ sudo apt install libopenblas-dev
Debian / Ubuntu / Raspbian: "Chiplotle3" command not found
After running chiplotle after intalling it through pip3 install chiplotle3, you might be prompted with an error that the command is not found. This might be caused due to a PATH problem. pip installs into ~/.local/bin, which is not part of the default PATH on Debain based operating systems.
Check your path:
> echo $PATH
Add to path:
> nano /.bashrc

[scroll to the bottom and add the line:]
export PATH="$HOME/.local/bin:$PATH"

restart your shell
Inkscape
The plot function is under: export > plot
Error: pySerial is not installed.
Please follow these steps:
- Download and extract (unzip) this file to your local harddisk: https://pypi.python.org/packages/source/p/pyserial/pyserial-2.7.tar.gz
- Copy the "serial" folder (Can be found inside the just extracted folder) into the following Inkscape folder:
/usr/???????? - Close and restart Inkscape
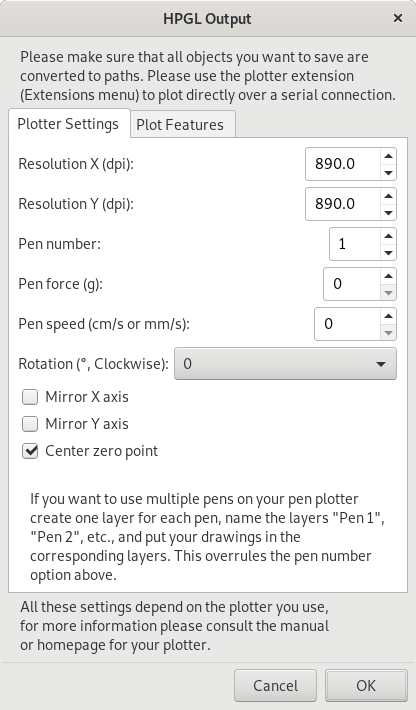
Make a vector file in Inkscape.
Save it as a HPGL file. See the image on the right for the settings.
For example: A3 landscape
Tip (!): landscape file = portrait plot. Make a landscape document, it plots in portrait orientation on the plotter (weird, but works)
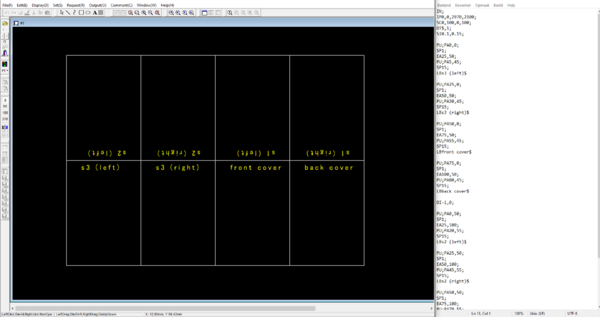
PloViewMini
PloViewMini is a tool to visualise HPGL code digitally. It's a demo version of the not-so-mini, regularly sized PloView -- which requires a license that seems to be supported no longer (?), but would allow you for more than just plowViewing, also ploDrawing and maybe even ploMore. One can download the installer from the Isoplotec site.
Installation Guide
Download the zip file from the isoplotec website.
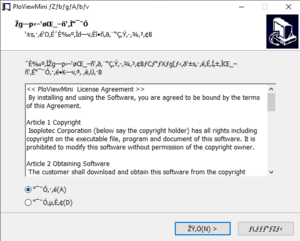
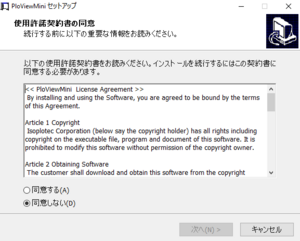
When running the file (on Windows), one may be prompted with a shady installation wizard. It appears it doesn't translate to Unicode characters properly, probably because the software dates back to the 80s. Forcing your OS to interpret non-Unicode characters as Japanese will reveal the true meaning.
Control Panel > Region and Language > Administrative > Language for non-Unicode programs > Change System Locale > Japanese.
- Select 同意する (agree)
- Click 次へ (next)
- For ユーザー名 (username), fill in a username (it should give a default option, which should be fine to use)
- For 組織 (organisation), fill in an organistion name (leaving it blank should be fine)
- Click 次へ (next)
- Click インストル (install)
Note that, at any point, you can click キャンセル (cancel) to cancel or 戻る (go back) to go back.
(This installation guide has been verified for Windows 10. Please append to it if your OS requires a different method.)
Pens
HP Fiber Tip Plotter Pens S Style Pens:
- $ 22 for 5: https://www.draftingsteals.com/catalog-plotters---plotter-supplies-plotter-pens-fiber-tip-plotter-pens.html
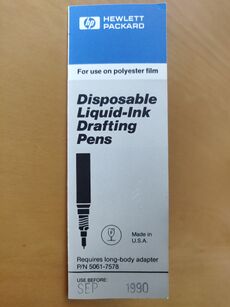
3d printable adapters for pens:
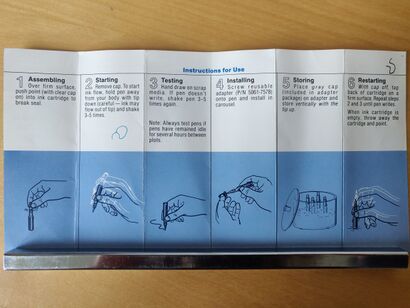
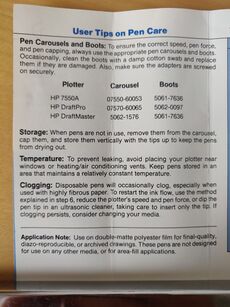
A manual for Disposable Liquid Ink Drafting Pens for use on polyester film. Best before September 1990.
|
|
|
References
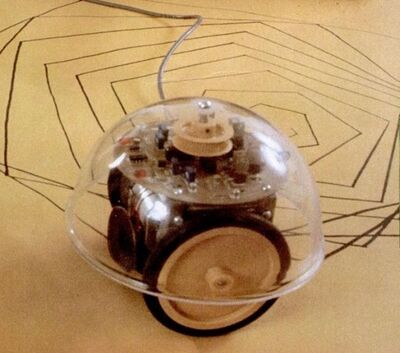
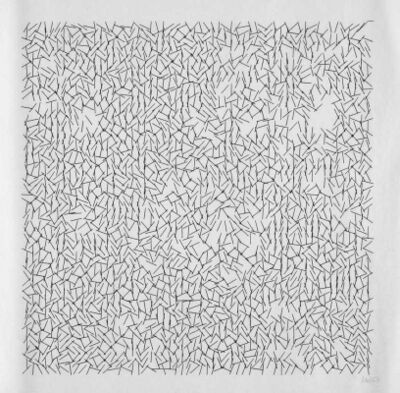
- Vera Molnár, women in early computer art (since 1940s) + Monoskop page
- New Tendencies movement, five international exhibitions in Zagreb, Croatia/Yugoslavia (1961-1973)
- Compas 68 (Dutch group around 1968/1969)
- Seymour Papert, Talking Turtle (1983)
- Mindstorms: children, computers, and powerful ideas, by Seymour Papert (1980)
- A Logo Primer, by the LOGO Foundation
- The Concept of a Metafont, by Donald Knuth published in Visible Language (1982)
- Pseudoplotter, an experimental art-zine about free non objective drawing in the spirit of Paul Klee's 'Pedagogical Sketchbook', by Marc van Elburg (2013)
- Drawing Curved, a collection of texts and images concerned with digital curvature, by Pierre Huyghebaert, Colm O'Neill with contributions by Femke Snelting (2018)
- REMAP, a hybrid sonic drawing device and interactive installation, by Signal-to-Noise (2015-2016)
- Up Pen Down research, fonts and workshops series by OSP (Oct 2017) + workshop (Oct 2015) + workshop at the ESAD Valence Grenoble (2012/2013) + publication outcome
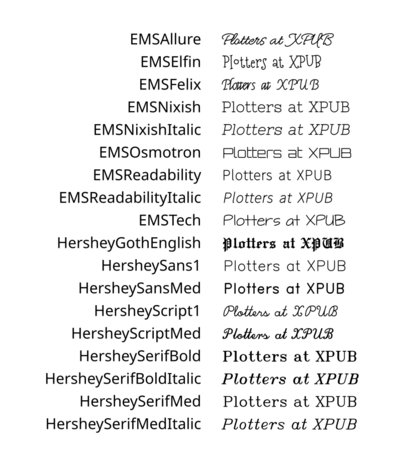
- Hersey Text, a stroke font Inkscape extension + link + wiki or see
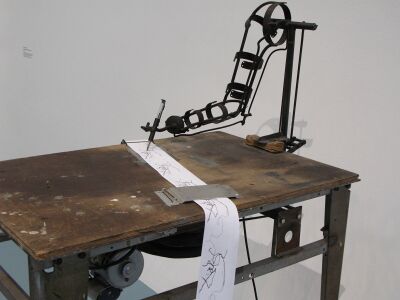
extensions > text > hershey text - Botopera, performance and installation by Gijs de Heij, An Mertens, Anne Laforette, Antonio Roberts, Michael Murtaugh (2015)
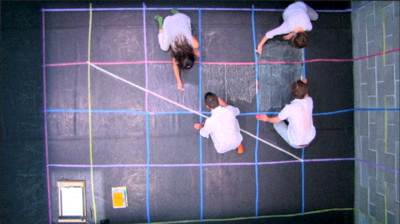
- Pensnake, by Joak (2022), pictures from Zinecamp 2022
I asked on the PPP chats if anyone knew any specific contexts/places where pen plotter enthusiasts meet, and the following links were send in return. Also, interestingly enough two people jokingly warned me for a recent attention shift they observed from pen plotting to nfts and AI, placing pen plotting into the field of generative art. – Manetta (talk) 13:20, 21 November 2023 (CET)
- https://bm.raphaelbastide.com/?searchterm=&searchtags=plotter+ (Raphaël Bastide's plotter bookmarks)
- https://ivan-murit.fr/
- https://mastodon.art/@thresfold@genart.social
- https://mastodon.design/@rmfrt
- https://twitter.com/Julien_Espagnon
- https://genart.social/@mwebster
- http://v3ga.art/
Tools/tutorials/techniques
- Upgrade for your DIY plotters: cross hatching
- Cross hatching in Processing
- Color layering with Ghostscript, Gimp & Inkscape
this pen plotter is (not) made to die
Printing repair sessions wiki page, initiated by Joak in 2023
Monday 30 + Tuesday 31 Oct 2023
Joak: On Monday (30/10/2023) and Tuesday (31/10/2023) I will be helping to repair the pen plotters between 5:15pm and 7:30pm. You have probably seen all the different (broken) pen plotters in the XML or Studio, these come from WDKA and other places. Most of them need probably just a small fix, some have a complex problem. These two evenings are just a start. I think by the end of this term 3/4 of the pen plotters should be working again.
If you are interested, just pass by. No previous knowledge of electronics, programming or pen plotters are required. These repair evenings are intended as an introduction to these topics. Everyone is welcome. Modus operandi: You will get an pen plotter on your table and step by step you will repair it over the next weeks or you will even modify it and do some imaginary (but still real) drawing tool/device.
Location: aquarium or studio
The plan is to do in the second trimester the same with (electronic) typewriters and in the third trimester with dot-matrix-printer!
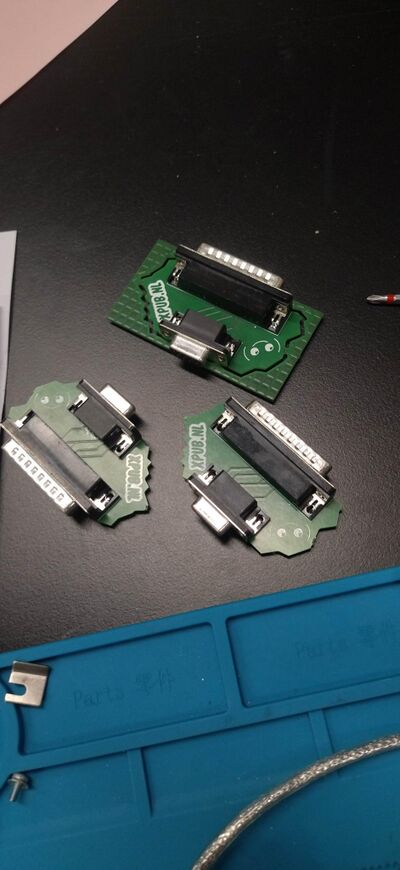
The DB9 to DB25 adapters were soldered. You can get the PCB files here: https://git.xpub.nl/XPUB/adapter
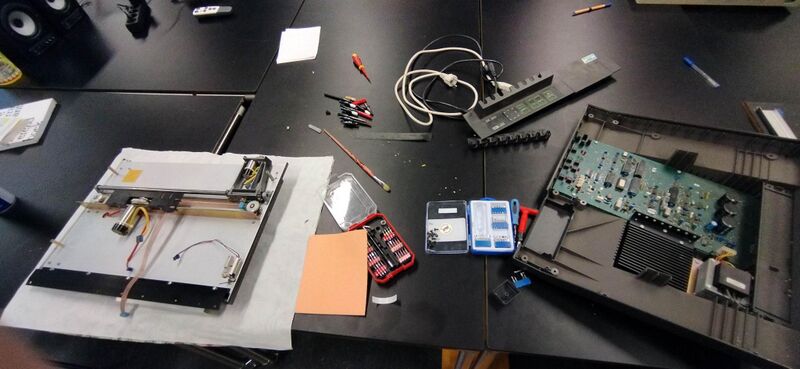
Plotters were opened, cleaned and inspected.
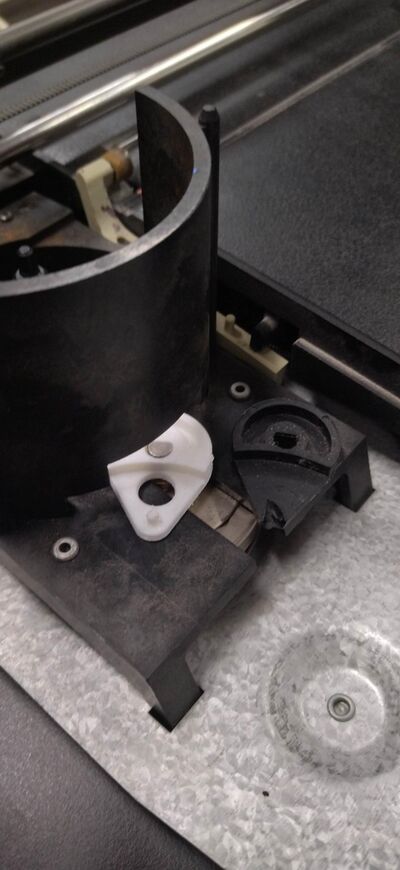
A broken part (the so called "Geneva Drive Wheel mechanism") was 3d printed for Printing/xml-plotter-1, a flipping part that let's the pen carousel rotate: https://www.thingiverse.com/thing:4696713 + https://www.youtube.com/watch?v=G5_YltaYZsg
Monday 13 + Tuesday 14 November
Victor and Joak looked into the alignment issue of HP 7475A, maybe its really a mechanical issue. It was solved?
Alessia, Thijs, Joak and Manetta worked on the TAXAN_X-Y_KPL710, see the repair log here: Printing/xml-plotter-3.
Monday 27 November
Plotter (pre-)party!!! 🎉
Monday 6 February
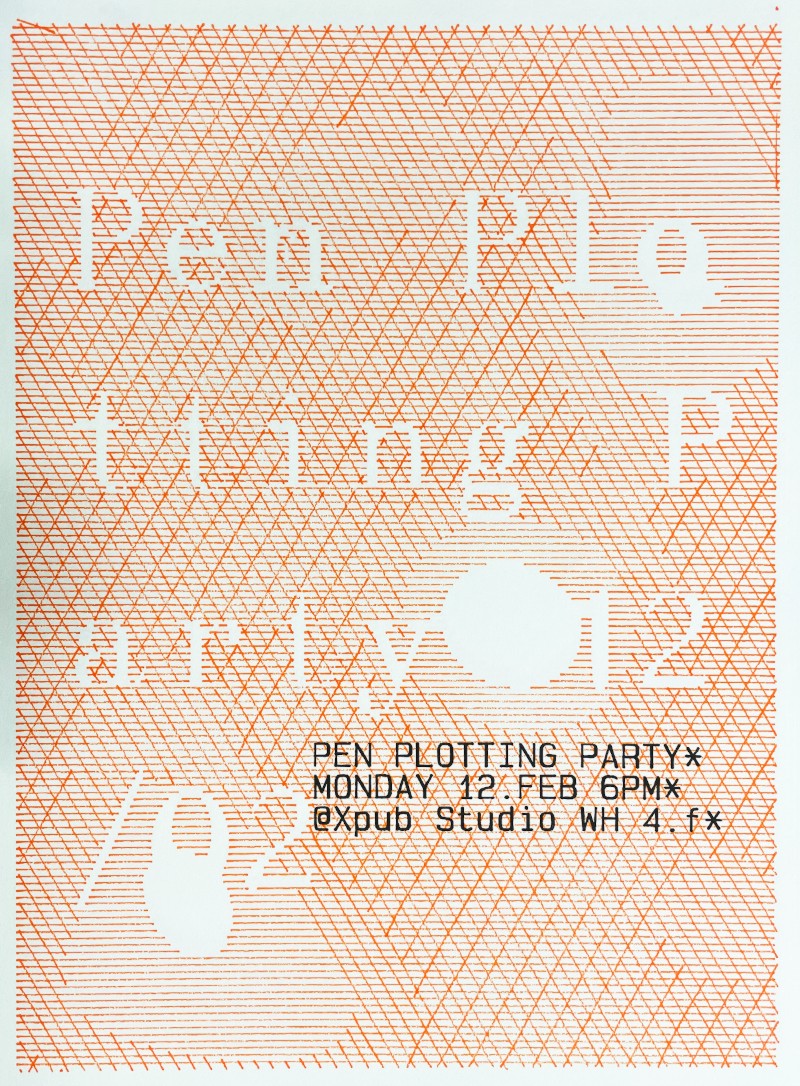
exciting news everyone: To kick of the new plotting-year there will be a Pen-Plotter Party on Monday feb 12. Save the date, and get ready for the launch of the Plotting table, Plotting zine alongside various plotting-activities. Do you want to contribute to this event? either contact @Thijs or @Victor on Zulip and join the pen-plotting-commitee!! 🖋
Prototypes, tryouts, projects, gallery
Drawing Horses In Your Own Way
Through incantations in the forms of ".hpgl"-files and chiplotle3 set up in a virtual environment (don't ask me why, it just happened to work out for all parties involved (why do it easy when you can do it hard?)). bridging the generational gap between my now state-of the art computer with the then state of the art pen plotter a series of adapters are engaged: from the plotter a custom parallel port to serial converter is connected to a USB to RS232 DB9 Serial Adapter Cable, which in turn is connected to a USB to USB-C adapter which plugs into the laptop. Allowing the two machines converse over a plate of chiplotle3. This gave me the opportunity to command the mechanical arm wielding the pen.
After getting to know each other I realized something was not as it should. The pen plotter would stop midway and the yellow(some would even say orange) light, labeled "error" would start blinking. A mangled piece of characters and numbers would then appear in the terminal window, maybe a cry for help, or an apology from the plotter, suggesting we try things differently.
To get back in the plotting saddle chiplotle and the machine must be restarted (in the reverse order). Sometimes the machines also need to be disconnected and reconnected (some personal space is always helpful). Even after all these steps there is a risk of the machine immediately go back in the same catatonic error-state, when asked to plot something new. maybe I should have listened more carefully to the warnings of "alignment issues" and "craps out midway"?
After repeating this choreography for hours I made som observations:
1. The machine seemed to stop randomly every time, even when the same plot was attempted.
- this may suggest that the issue was rather of a mechanical-nature as opposed to to electrical/software-related.
2. Smaller plots were more reliably plotted.
- This may suggest that the issue was related to movement, as the bigger the plot, the more movement the more likely to error the machine was.
3. For some plots there were some specific regions/lines where the plot would fail, I noticed a pattern that these were usually lines that were parallel to the long edge of the paper.
- This may suggest that the issue was related to the movement of the paper. (The machine plots in an Cartesian coordinate system, where the movement of the pen gives moves it through one axis (let's say "y") and a roller moves the paper in the other axis (let's say "x")).
Based on these observations I formed a hypothesis that the reason the plotting machine stumbled, was the fact that like most old things their agility declines, affecting how certain task can and/or can't be performed. More specifically that it stops because its ability to move paper in the "x-axis" was compromised. To further test this hypothesis I tried to move the roller that is supposed to move the paper, when it had errored. To my (not so?)surprise it seemed stuck, and I could just barely move it with the application of force. (I have to note that this was not a pleasant experience, as for all I knew this could really damage the machine, but desperate times – desperate means (or something). At this point I knew ish what was wrong, that the machine struggles with moving the paper, but I did not have the courage or knowledge to act upon the discovery and "repair" the machine. It was still able to plot the line on the paper, so maybe I was the one who needed to change?
In order to plot I was required to be more considerate of the needs and quirks of this specific pen plotter. So how could this be achieved? I needed to reduce the amount of movement in the x-axis as much as possible. To accomplish this I constructed graphics made of lines only in one axis. This was done with image-manipulation software the likes of GIMP or Inkscape. By separating different color channels, or different leves of lightness/darkness in an image or drawing, and then making these layers into shapes with a threshold, and use the outlines of the shapes to mask a layer of parallel digitally constructed vector-lines. This strategy proved effective, and the amounts of errors was greatly reduced.
A new challenge appeared after this technique was implemented. The fact that the machine still would fail, made it so for certain plots it would never reach the end of a plot even after many tries. When you restart the plot it starts from the beginning again, putting the plotter and plot-operator in a sisyphusian position, of never reaching the end of a plot. A work-around for this was for in the event of an error to manually remove the code that was already plotted in the hpgl file. For this one has to know what you can safely remove from the hpgl file without corrupting it, and a good sense of the nominal relation between lines plotted and lines to plot, and their coded incarnation on the computer (If it looks like half the image is plotted remove about half of the hpgl code(maybe a little less, just to be sure)).
After developing this understanding relationship with the plotter I was able to consistently plot as long as a I adhered to the negotiated protocols. In it´s limitations layed vaste opportunities to be explored.
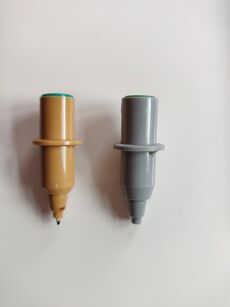
The plotter did only know how to hold very odd and specific pens. Fortunately any pen plotter can hold any pen with a little bit of tape and tac-it (not verified) all you do is stick it to one of the odd and specific pens. In this process one has to careful as so the tip of the desired drawing-utensil lines up with the tip of the undesired odd and specific pen. Thus ensuring the right amount of pressure. A byproduct of this is that you get a trippy and cool shadowed effect, since there are now two pens drawing rather than one. If this is not to your liking you can use an empty odd and specific pen, or dissect an unused odd and specific pen and remove the "drawing-parts".
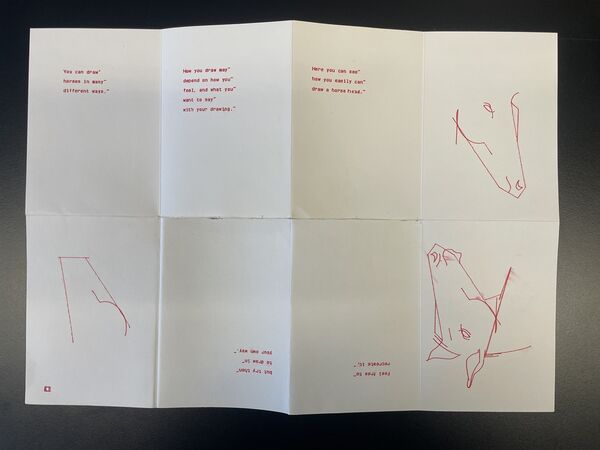
Horse drawings made to line art
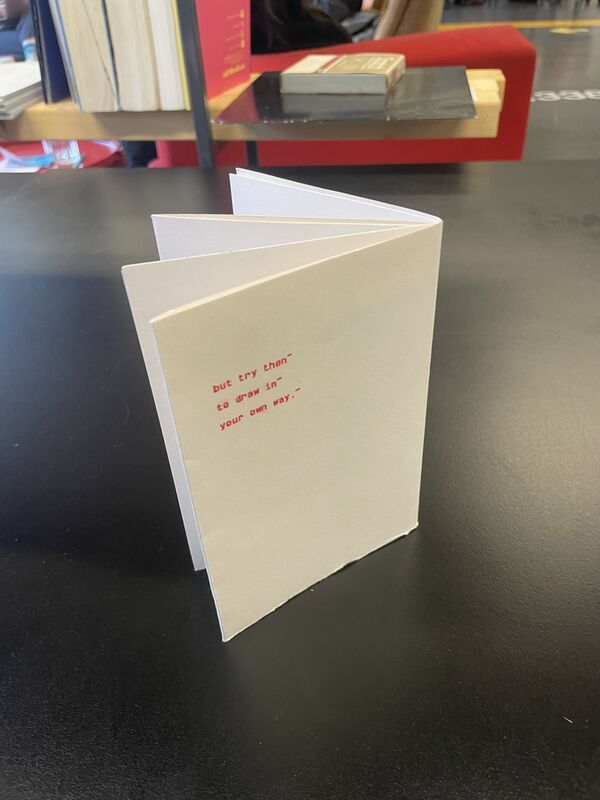
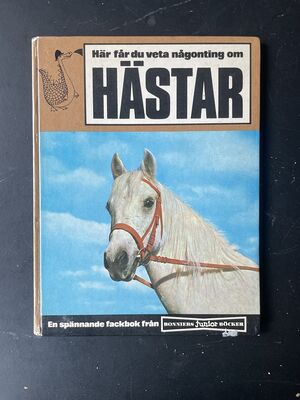
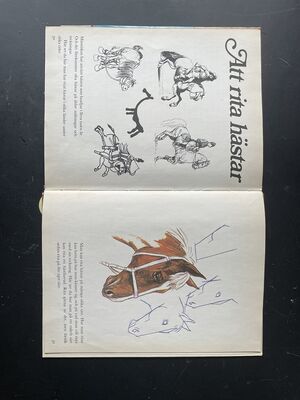
Now equipped with all the tools explore a lot of shapes and colors together with the HP 7475A, all I needed was some content to plot. All of these events unfolded in a time where drawing horses felt important to me, therefore I had received a Swedish children's book about horses from my sister as a gift, to help me in my horse-studies. The book contained a small tutorial on how to draw a horse, whilst still suggesting that horses can be drawn in many ways, and one should find explore your own way to draw a horse. Rather than to confine to some horse-drawing-paradigm established by the shadow society. This passage of the book moved me, and I had an urge to share this wisdom. Thus I recreated this drawing tutorial in plotted form. Following the tutorial myself drawing digitally. This step by step tutorial covers one side of a A3 sheet and the other is filled with collages of different horse-drawings I have made plotable, varying the colors and motives, creating "unique" prints, that still confine to the same logic and share the same mythos.
Plotting volume levels
For a dedicated page on this topic, see User:Thijshijsijsjss/Pen_Plotting_Panache/Volume_Plotting
At Machinecamp, an event accompanying zinecamp, Victor and Thijs gave mini penplotter workshops to visitors. During the event, they wrote some javascript code to capture ~2 minutes of audio and translate the volume levels to HPGL. This was then sent to a plotter.
It is available with a web interface as part of the SI23 quilt.
The code can also be found at the dedicated wiki page.
Crosshatching experiments
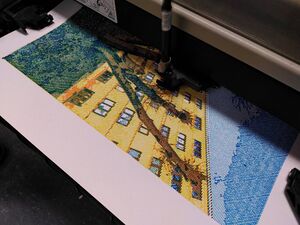
For dedicated pages on this topic, see Plothatching and User:Thijshijsijsjss/Pen_Plotting_Panache/Plothatching_Workflow
Inspired by https://hackaday.io/project/20585-upgrade-for-your-diy-plotters, Victor and Thijs wanted to do some crosshatched plots. They wrote a processing script to convert images to crosshatched versions. By doing this for an image's different CMYK color channels separately, it is possible to create intricate multicolor plots.
- Some more examples can be found at User:Thijshijsijsjss/Pen_Plotting_Panache/Gallery
- The workflow can be found at User:Thijshijsijsjss/Pen_Plotting_Panache/Plothatching_Workflow
- A dedicated page on the code can be found at Plothatching
Twitch Plays Plotter
For a dedicated page on this topic, see User:Thijshijsijsjss/Pen_Plotting_Panache/twitchplaysplotter
twitchplaysplotter is a project inspired by TwitchPlaysPokemon in which a pen plotter can be controlled through the chat of a Twitch livestream. This project, worked on by Rosa, Victor and Thijs, was initiated both to experiment with the collaborative and performative nature of plotters, and to facililate participation of pen plotter enthusiasts who were not able to make it to the 2024-02-12 pen plotting party physically.
Universal pen holders
For a dedicated page on this topic, see Pen_plotters/Pen_Hacking
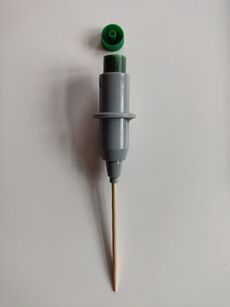
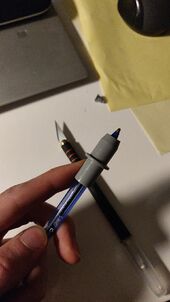
There are 'real' pens, meant for pen plotting. These tend to work nicely, are very friendly to use, and often provide nice results. However, they are limited in color selection and pen texture. Therefore, one might consider using their own pens. These pens need to be loaded in a holder. One can modify a 'real pen' for this purpose, or alternatively 3D print a holder.
An example of pen hacking:
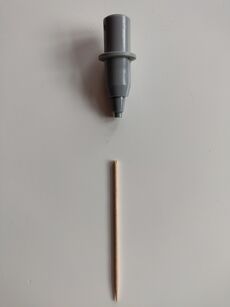
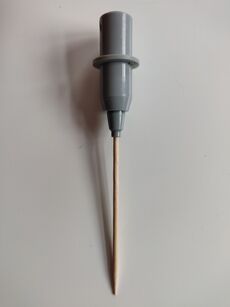
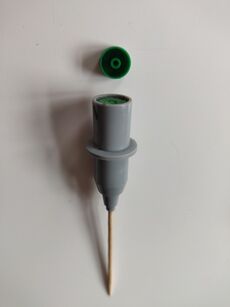
Not all pens allow for their intestants to me removed so easily, in which case a knife is required.
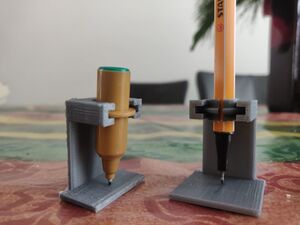
You can also 3D print custom holders. This is a reliable way of obtaining a large number of holders, which has the benefit of being able to have one holder per pen, so that you don't have to align them each time you switch pens.
- This is a GitHub repo with many stl files. The one I have tried did not work for me, however (too slim for the pen specified, or not aligned properly).
- We have modelled new ones (specifically for stabillo 68 / 88 pens), the stl files for which can be found here on Gitea.
Vertical alignment tools
When using a custom pen, it is crucial to align it properly heigh wise. This can be done by hand, by comparing a pen in a custom holder side by side with a 'real' pen. To make this process more reliable and less tedious, we have also modelled a rig for veritcal alignment. These files can be found here on Gitea
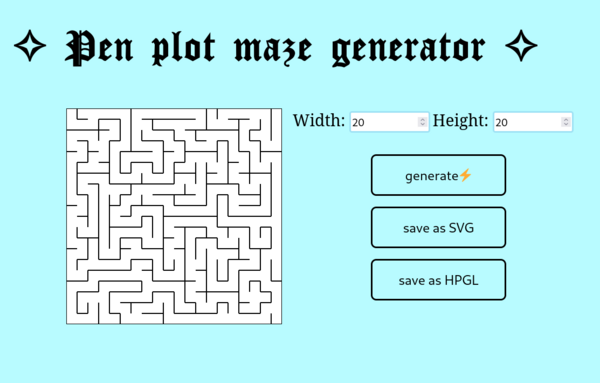
Pen plot mazes
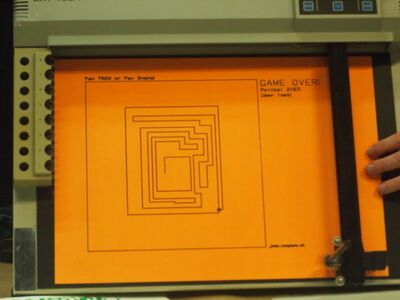
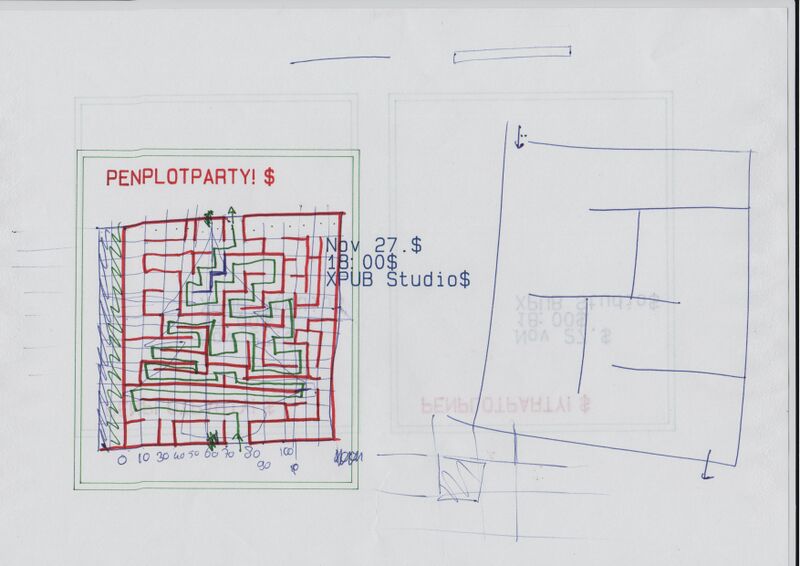
For the first pen plotter party, Alessia and Thijs prepared a pen plotted maze, intended to be solved by (crazy competitive) manually plotting.
Alessia worked on a pen plotter maze generator (that saves mazes as svg files, still working on the hpgl file generator part), here it is -> Pen plot this maze!
Mouse tracing plots
A rapid prototype by User:Ssstephen
rodent trace ornamentation
a few weeks ago i made a script that saves my mouse actions to a text file. and by made I mean i pressed, among other buttons, ctrl+c and ctrl+v.
from pynput.mouse import Listener
import logging

logging.basicConfig(filename="mouse_log.txt", level=logging.DEBUG, format='%(asctime)s: %(message)s')

def on_move(x, y):
    logging.info("Mouse moved to ({0}, {1})".format(x, y))

def on_click(x, y, button, pressed):
    if pressed:
        logging.info('Mouse clicked at ({0}, {1}) with {2}'.format(x, y, button))

def on_scroll(x, y, dx, dy):
    logging.info('Mouse scrolled at ({0}, {1})({2}, {3})'.format(x, y, dx, dy))

with Listener(on_move=on_move, on_click=on_click, on_scroll=on_scroll) as listener:
    listener.join()
today I want to send that data to the plotter instead in a language it understands. i want to do this as a way of ornamenting and documenting the work that happens through the mouse or trackpad. pen plotters are often used for presentations: it is about finding what is between the past and the future. i want to try not to focus on the cartesian coordinates in the data but they might be useful. the data looks kind of like this:
2023-10-25 12:17:36,329: Mouse moved to (1816, 799)
2023-10-25 12:17:36,337: Mouse moved to (1814, 799)
2023-10-25 12:17:36,345: Mouse moved to (1812, 799)
2023-10-25 12:17:36,353: Mouse moved to (1809, 800)
2023-10-25 12:17:36,361: Mouse moved to (1807, 801)
2023-10-25 12:17:36,369: Mouse moved to (1805, 801)
2023-10-25 12:17:36,376: Mouse moved to (1803, 801)
2023-10-25 12:17:36,385: Mouse moved to (1800, 801)
2023-10-25 12:17:36,393: Mouse moved to (1799, 801)
2023-10-25 12:17:36,401: Mouse moved to (1798, 801)
2023-10-25 12:17:36,553: Mouse clicked at (1798, 801) with Button.left
2023-10-25 12:17:36,729: Mouse clicked at (1798, 801) with Button.left
2023-10-25 12:17:37,440: Mouse moved to (1798, 801)
2023-10-25 12:17:37,953: Mouse scrolled at (1798, 801)(0, -1)
2023-10-25 12:17:37,969: Mouse scrolled at (1798, 801)(0, -1)
2023-10-25 12:17:37,977: Mouse scrolled at (1798, 801)(0, -1)
2023-10-25 12:17:37,993: Mouse scrolled at (1798, 801)(0, -1)
2023-10-25 12:17:38,009: Mouse scrolled at (1798, 801)(0, -1)
2023-10-25 12:17:38,033: Mouse scrolled at (1798, 801)(0, -1)
2023-10-25 12:17:38,040: Mouse scrolled at (1798, 801)(0, -1)
2023-10-25 12:17:38,057: Mouse scrolled at (1798, 801)(0, -1)
2023-10-25 12:17:38,065: Mouse scrolled at (1798, 801)(0, -1)
the data being collected in the script that i can see:
- something happened (listener)
- it happened now (asctime)
- by something, it was either a click, move or scroll
- it happened somewhere xy (this is presented as if it's two pieces of information, weird)
- if it was a click, it involved a particular button (strange my trackpad does not have buttons)
- if it was a scroll it moved to another relative position dxdy#
how to track and dance with the work done by the rodent? how long has it been since you last did something? the longer its been, the further you move. the direction isnt important yet.
Its working. the longer I take to move the mouse, the longer the line becomes. the script is like this:
# It sends your mouse data to the pen plotter to see
# what you're up to over there.

from chiplotle3 import *
import math
import random
import time

from pynput.mouse import Listener
import logging

# initialise chiplotle
plotter = instantiate_plotters( )[0]

t0 = 0
t1 = 0
dt = 0
x = 0
y = 0
notplotting = 1
eventwaiting = 0
button = "0"
coords = []

plotter.select_pen(1)
plotter.write(hpgl.PU([(0,0)]))

print("init done")

def on_move(x, y, button="Left", pressed="1"):
    #logging.info("Mouse moved to ({0}, {1})".format(x, y))
    global t0
    global t1
    global dt
    global notplotting
    t0 = t1
    t1 = time.time()
    dt = (t1-t0)*1000
    print("new move length is " +str(dt))
    if dt > 3000:
	    plotnow(dt)

def plotnow(dt):
	print("plottin now")
	dx = int(dt/100)
	plotter.write(hpgl.PU([(0,0)]))
	plotter.write(hpgl.PD([(-dt,7000)]))
	time.sleep(0.1)

with Listener(on_move=on_move, on_click=on_move, on_scroll=on_move) as listener:
    listener.join()
plotting and doubting irrationally
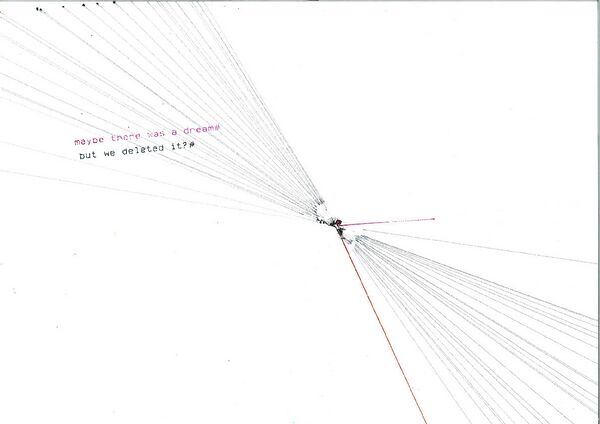
so in summary the script gives bigger gestures the less work is done by the rodent (the longer the times between gestures on the trackpad). It is a celebratory performance of laziness. It encourages working less. It measures the opposite of time and translates it to vectors. There is an inverse relationship between busy-ness/business and the intensity of the performed gestures.
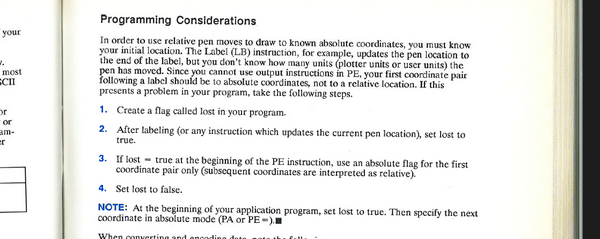
to do: should the hpgl commands be relative instead of absolute? it would be more lost then which would be nice. Its something to do with gregory bateson and christopher small and taylorism and Frank and Lillian Gilbreth. Joseph says talk to steve rushton about it. is the language getting too abstract or is that the point?
https://zetabooks.com/wp-content/uploads/introSP22.pdf
PLOT TWIST - it was not a technical issue
by Kamo
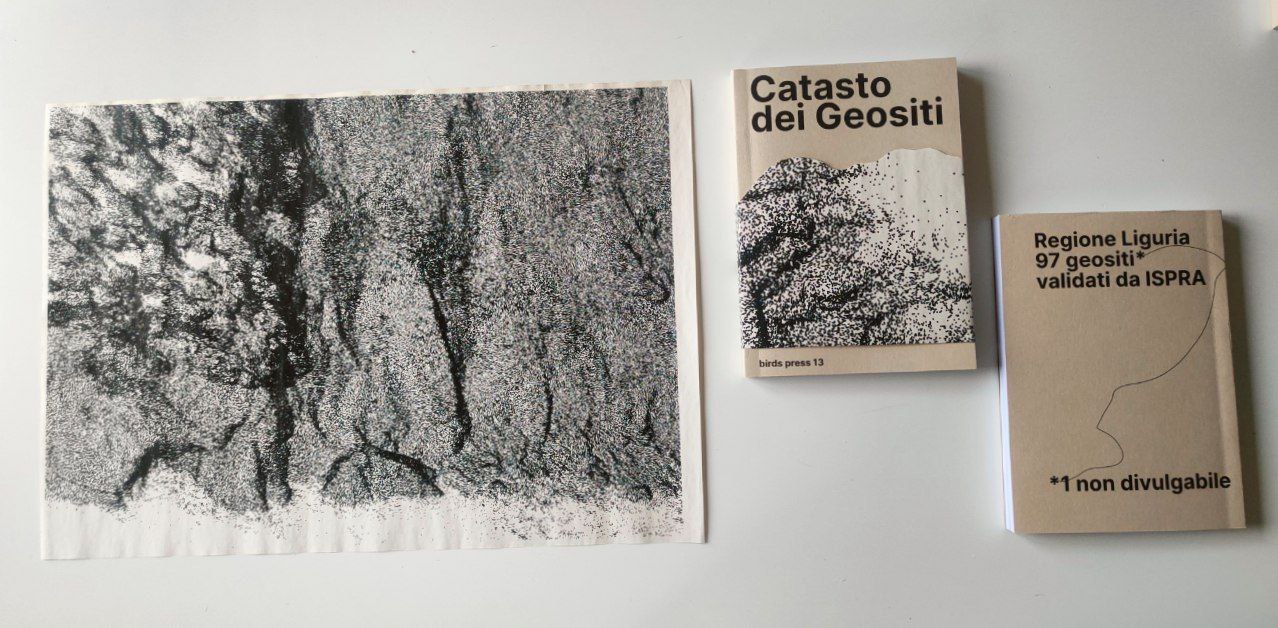
For the last four years I've been researching practices of 3D documentary, finding some interesting tension between a genre that traditionally claims to be "objective" and "natural", and a super digital & constructed technique such as photogrammetry. ( A process to create 3d models starting from a series of photos of the same subject).
Eventually this tension resolved with the growing awareness that the friction is not a matter of technical complexity or abstract remediation, but more related to the context around each tool, its language, and the way it interacts with its surroundings.
With this in mind I've started enjoying working with photogrammetry models, despite their visual clunkiness and not-so-ergonomic form-factors. In particular, I've been busy with pointclouds portraying geological subjects, such as avalanches and quarries.
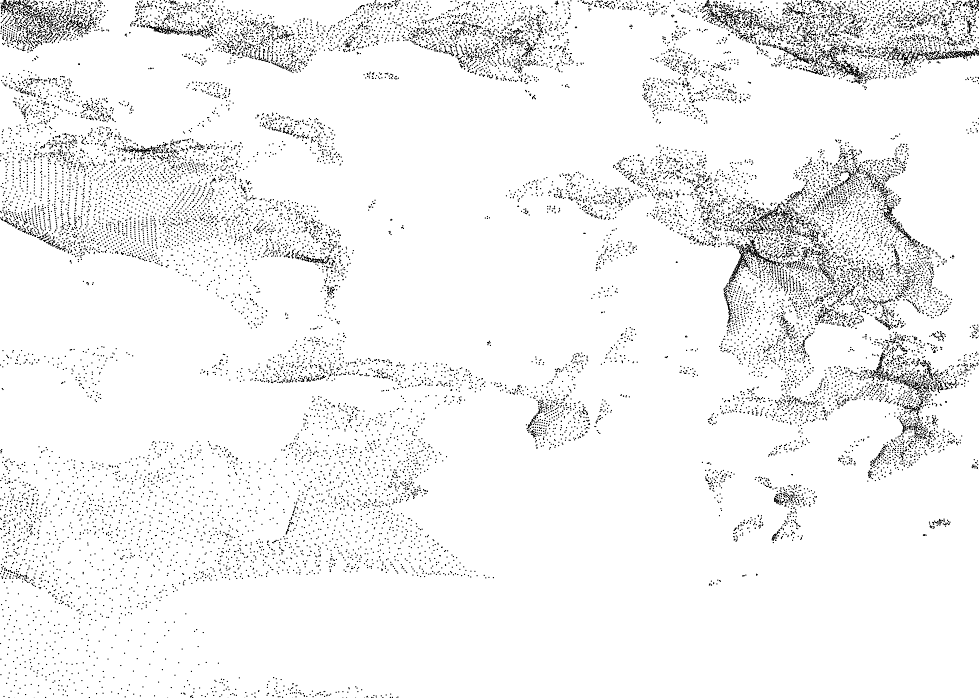
Pointclouds is pointillism for 3D models, and from pointillism to plotillism is really a short call.
So here is a prototype to transform pointcloud files (.ply) to SVG ready to plot, in short: plyplot.
1. Take a lot of pictures of an avalanche 2. Generate the photogrammetry with software such as Meshroom, export it as .ply file 3. Run plyplot to render the SVG 4. Plot
Plyplot is a vvvv script that project the 3D pointcloud into a 2D view, rendering it as an SVG.
Outcomes and issues
⭐️ Some plotters complained! Too many points to plot. Wonder if the bottleneck was inkscape, since I was plotting from the its plugin. Will try a more lazy approach, sending just a few point at the time and not all of them together. (This is somehow the way NLTK uses to operate with very large dataset, or haskell with infinite lists)
⭐ The SVG paths were triggering some error in the plotter: probably because their coordinates were overflowing the viewbox attribute of the SVG. Solved it by applying the transform to the path positions before rendering the SVG.
⭐ The programming environment caused some problem! Plyplot was developed in vvvv, a visual programming language really handy to develop quick prototypes. It's my go-to choice when I want to relax and figure out a problem having fun.
Unfortunately the editor is available only for Windows, that is not exactly the most popular OS in the xpub bubble.
In my two years studying here, I've progressively used it less and less, especially for the reason of not being able to share the scripts with my dear friends, and a perceived problem of technical accessibility.
My initial aproach to share it was to rewrite it using browser based libraries, but because of time and energy constraints the plan didn't work out. During the research I found indeed some really interesting resources linked at the end, but in general the contribution was spiraling, an not in a plotter way.
I had almost decided not to share anything, until I realized:
What if this script doesn't need to be universally accessible? What if the operative system it runs on is not a technical problem, or a problem at all? What if it's already enough, even precious to share the tool and the context around it, the situation from which it emerged?
Plot twist: it was not a technical problem. It wasnt even a problem at all.
Somehow these thoughts resonated a lot with the initial riddle between documentary and 3d and the situatedness of a tool. So I felt like sharing the script even though it runs only on windows 😝😝😝 Find it on the xpub git tomorrow!
This was a nice redemption arc for me, I humbly thank my friends in the bubble.
Resources:
https://git.xpub.nl/kamo/plyplot
https://www.generativehut.com/post/render-3d-scenes-from-webgl-to-svg
What even is a pen plotter???
by Alessia
🔙back to menu🔙
Personal essay evolved after a sudden presentation about pen plotting to some unsuspecting friends (> their random comments here included), inspired by zulip messages and insomnia
✦ . ⁺ . ✦ . ⁺ . ✦
What even is a pen plotter?
> Can I say that it sounds funny as a name? plotter
> Oh wait I saw them on tiktok there are plenty of videos of these m a c h i n e r i e s
> Yes, kinda trending
They are iconic devices, magical pioneers of digital graphic reproduction, machines that left an indelible mark in the history of visual art + computer graphics and in each of our hearts. Even if sadly pen plotters were replaced by large format inkjet printers, we are now experiencing a new renaissance for them, even outside the xpub bubble. With such nostalgic appeal they attract even more. Artists from all over the world acclaim them again as their new favourite tools, to be safeguarded, cherished, resurrected.
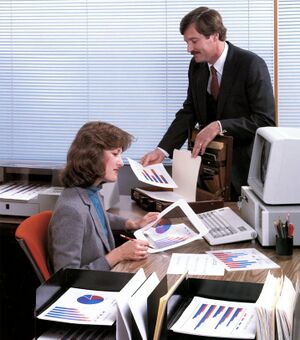
Modern digital plotters, which are still in use today, evolved from analog XY writer plotters that operated along two axes of motion. They were the most efficient way to draw vector graphics, rather than raster images, making them ideal for tasks like drafting blueprints, graphing data, and producing large-format maps.
> I don’t understand, weren't you doing things with the radio?
> pen plotters look even scarier than computers I swear
One of the earliest plotters was Konrad Zuse's Graphomat Z64 in 1958, a punch card controlled plotter, driven by two gears. Frieder Nake, THE Algorist (along with Vera Molnar, Georg Nees, A. Michael Noll, and Manfred Mohr) used this machine, for which he developed a software for his experimentations.
One of the first mechanical and commercial plotters was the CalComp 565, from 1966, a drum plotter that worked by placing the paper over a roller that moved the paper back and forth along the X axis and the pen moved back and forth along the Y axis.
> luckily you are showing images I wouldn’t understand a thing without them
> damn diabolic m a c h i n e r i e s
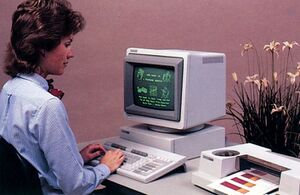
The progress of plotter technology was a key part for the development of CAD (Computer Aided-Design, software used by designers and engineers to create detailed digital drawings and models of objects or structures). The Computervision's Interact I plotter, was designed to be a combination of a digitiser and a plotter, serving as an interactive terminal. Users could copy a sketch, see it on a screen, edit it, and then print out the changes.
The great change for pen plotters arrived with the crafting of the flatbed plotter. As the name suggests, the surface to be drawn on was laid out flat, different from before, as paper was rolled up on a drum. HP was the big guy for commercial plotters. HP's first plotter was the 9125A flatbed plotter, introduced in 1968.
Again HP, the HP 7470, born in the 80s, introduced the grit wheel mechanism: rollers pressing at opposite edges of the sheet to control movement. The pen is mounted on a carriage that moves back and forth in a line between the grit wheels.
Plotters were also used in Create-A-Card kiosks, to make little postcards, that were available for a while in supermarkets. They used the HP 7475A six-pen plotter.
The most used modern pen plotters at the moment are the one from AXidraw by Evil Mad Scientist Labs, their firmware is open source: https://github.com/evil-mad/axidraw.
> I’ll still use my hp printer
> I don’t understand how this is connected to the radio
I am done, done, let's speak about art c’mooonn.
Firstly, pen plotter art: is it really art?
There isn’t much about plotter art in general, in books or on the internet. Grouping people together is always a way to ghettoise them, what does it even mean to be a pen plotter artist? Is there any kind of typical philosophy that is embedded to practising art through this kind of machine in particular? Each artist brings their unique perspective and creative approach to the intersection of art and technology. Art romantically is creativity, but in the real world art is money. We saw this in the fascinating rise of NTF that stained pen plotter art as well :)
> NFTs are still a thing?
I got to discover (from an Interview with Frieder Nake by Mark Amerika) that THE algorists, even if they were programmers, still had people writing codes for them. This made me smile, remembering all those great personalities, those artists whose names are printed into history books, whose real artistic production is reduced to the bone, maybe even less. Who knows how many works of art have been created with the creator, to whom these works are attributed, moving their brilliant hand just to sign them, while studio cadets sweated over fresh canvases? Or in this case: over keyboards.
> uuh we are getting into the social critique part now. spicy.
> like my internship you mean. I feel this.
> Idk, maybe they were paid this time, not enslaved like renaissance boys
I had prepared a very long list of names, all contemporary artists, as I wanted to find mainly artists that are still involved in the art scene, who have jumped from the bank of computer science to the bank of visual art, falling into exhibitions, museums, glossy newspapers superficial interviews. I don’t really want to show it anymore (hahaha no it's here actually list pen plotter artists ). It is a very different world from our studio and perhaps from those who see pen plotters in a more sincere, curious, way of rediscovering forgotten tools. I also wonder how much my own gaze is directed at the art industry more than at the creative act itself, there would be too much to say. I will not tell you about this whole list, just some hints.
> but can the plotter do other stuff other than plotting?
> maybe make food? Sing a song?
> what’s the point of making something do what it is expected to do?
Generative art! Talking about pen plotter art without mentioning computer and generative art is impossible. Pen plotters undeniably played an important role in the evolution of both of these art movements, as they were among the earliest digital tools available to mathematicians, scientists, and programmers to push that immaterial boundary between art and science.
Mafred Mohr, Vera Molnar Frieder Nake, George Ness, Herbert W. Franke, are all great science-computer-artists that experimented with generative art and visualised their ideas through pen plotting. It’s interesting to see how pen plotting built a bridge between new digital computer technologies and traditional printmaking techniques. I am speaking about dirty hands, acids, and staining inks that were at some point being linked to the cold grey plastic reality of computer hardwares.
A whole new world.
Pen plotters, as computers, weren’t really naturalised, common to have around, Mohr had to use the ones from the Paris Institut Météorologique. I imagine what the guys there would have thought about this person using their machinery, for art??? Other remarkable pioneers of pen plotter art still included under the generative art umbrella are: Harold Cohen, Mark Wilson, Peter Beyls, Roman Verostko, Jean-Pierre Hébert, Casey Reas.
A lot of exhibitions, a lot of thirst for recognition.
I get the feeling that all these artists have only attempted to create randomness and chaos, without actually creating it. Some sort of extreme quest of control over that human desire for chaotic disorder. Randomness by computer is still perceived as the total antithesis of randomness by humans, but is this really so?
it's not that we really know where randomness originates and develops in the human mind, it might be more logical than we think.
> that’s too philosophical, show us some weird things
Artists that use pen plotters as mediums, that are mainly involved in the generative art movement, explore human-machine interactions (Sougwen Chun), even seeing them even as conversational (LIA), focusing on dynamic-fluid-esoteric forms and structures to get over the feeling of rigidity and inflexibility of the pen plotter involvement (Alida Sun). They let plotters be performative devices and storyteller, creating spaces that aim to even just enhance human interactions (Jürg Lehni-Jessica In), creating illusory fake organic structures, playing between harmony and chaos (Tyler Hobbs - Zancan), self-building frankenstein punk machines with paintball guns (Antigoon), working on data visualisation and sound design (Peco). There are so many artists out there that are involved in the pen plotter art, but, if I may, in a quite superficial way. The machine is the machine and it will draw the generated artwork. But isn’t there something more?
It’s somehow sad that plotters have been regarded merely as tools, peripheral tools. Yet, how wonderful the moment when a symbiotic relationship is built between the materials involved and the human action of letting the machine be a companion more than a device. Boundaries blur, and the machine assumes a quasi-autonomous presence in the artistic process. A dynamic of interplay, welcoming complexities and material vulnerabilities that working with this kind of machines introduces. Maybe even embracing the unexpected as a sort of performative act. Could this be seen as fetishization? Probably.
Anyway, it was Nake who was one of the first to sign his works with NAKE/ER56/Z64, acknowledging the computer system and plotter as integral collaborators in his artworks. The discussion about the legitimacy of recognizing hardware/software as authors, giving them a characteristic of humanity, is still very much open, now even more so than before. If it is the machine that produces the artwork, does that make it the only legitimate author?
It seems that James Pyle, from CalComp, thought so, when he held an international art competition in which plotters had to be the main tools used. Most of the art pieces didn’t have any attribution to the human artist involved in the creation of the pieces, just to CalComp :)
There is something mystical, enigmatic, about how pen plotting challenges what is the conventional notion of what drawing as an act is.
Drawing is viewed as an inherently human process, we are quite proud of it. Art history is based on that epic moment when some person decided to draw scenes of hunting and drugged shaman dances inside caves. We glorify the act of visual creation. The endlessly repeating of that act by the plotter alters that sense of sacredness that arises from the artist's personal touch, it makes some existential insecurities emerge.
Let’s embrace this! Let’s embrace a vision of the plotter as a machine that disrupts, add that transgressive element into the artistic process that is so much needed.
Is it still ok to go on? Usually, it is the end part, in a presentation of this type, that tries to be all nice and pompous and glossy. It is the grand finale, so get to the end.
After having conversations about pen plotting with both Thijs and Manetta, who I thank deeply, I would say that I may have gotten a little bit entangled in my typical flat bullet point fine art analysis, like I would speak about established art movements (even if art is not established at all, movements don’t even exist in the real sense of things).
I would say xpub experimentations got over my head while I was exploring all those polished generative art online exhibitions. I should speak more about what pen plotting is for us as a community of students, and what might be.
Indeed, pen plotting has been a great community tool shaping for us. It became the glue that let us stick together more in the studio and let us know more about each other, how cheesy!
As we are all from different backgrounds, we let machines be our companions in what is our own personal digging into experimental publishing, media archeology, skill building, tool making, performing acts, all done collectively. A plotter culture is emerging, it surely is.
For so long, I tried to destroy the wall between me and pen plotting as a technical tool, and only thanks to the skills and energy of my classmates did I succeed partially. Perhaps my role is to silently rant, more or less, about the techno-philosophical-exciting aspects of (lovely) metal boxes.
As I believe our xpub bubble is a bubble but still influenced by the outside world, I am looking forward to connecting with other bubbles, conquering the world together or something. There must be life out there!
(*ˊᗜˋ*)/ Thanks to:
Stefano, Edoardo, Thijs, Manetta
Reference Links:
https://www.hpmuseum.net/exhibit.php?class=4&cat=24
https://www.rightclicksave.com/article/an-interview-with-frieder-nake
https://computerhistory.org/
https://monoskop.org/images/7/7b/Noll_A_Michael_1967_The_digital_computer_as_a_creative_medium.pdf
https://ethw.org/First-Hand:Howard_Wise_Gallery_Show_of_Digital_Art_and_Patterns_(1965):_A_50th_Anniversary_Memoir (Computer Program for Artists: ART 1 Katherine Nash, Richard H. Williams)
https://www.jstor.org/stable/1572264
https://www.shapr3d.com/history-of-cad/computervision
https://medium.com/nightingale/pen-plotters-are-the-perfect-tool-for-data-storytelling-b05c71ceadd5
https://www.generativehut.com/
https://news.ycombinator.com/item?id=16495236
Pen Plotting at XPUB (wiki-zine, version Nov/23)
A series of pen plotting zines based on this wiki page!
It's generated directly from this wiki page, using Weasyprint and Pandoc as part of Booklet.sh.
version 1
A5 booklet that was printed to celebrate the plotter party on Monday 27 November at the XPUB studio.
The PDF can be found here, and a booklet version here.
version 2
A5 booklet that was printed and collectively bound on the occasion of the PEN PLOTTING PARTY* at Monday 12 February 2024 at the XPUB studio, https://hub.xpub.nl/chopchop/PEN-PLOTTING-PARTY/.
https://git.xpub.nl/XPUB/pen-plotter-zine/
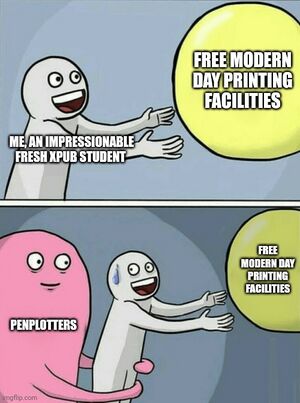
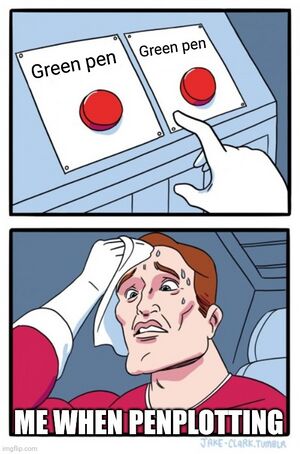
Pen plot memes
See also
Prototypes, tryouts, projects, gallery
Plotting volume levels
At Machinecamp, an event accompanying zinecamp, Victor and Thijs gave mini penplotter workshops to visitors. During the event, they wrote some javascript code to capture ~2 minutes of audio and translate the volume levels to HPGL. This was then sent to a plotter.
It is available with a web interface as part of the SI23 quilt.
A modification of the code written at Zinecamp 2023 that captures audio and makes HPGL code for a volume plot. This version is more user friendly, with buttons for starting, restarting and copying, and with input length and title. Like this:
Volume plotting is part of the SI23 webquilt! Find it here, or get your own with the code below:
<!DOCTYPE html>
<html>
<head>
<title>Noiseplotting!</title>
</head>
<body>

<h1></h1>
<p>This is a small script to capture a snippet of sound and convert it to a volume HPGL code for your penplotting pleasure. </p>
<p>Usage:
<ol>
  <li>Press the button saying 'Start recording'.</li>
  <li>Wait until recording is done, indicated by HPGL code appearing below.</li>
  <li>Copy the HPGL output if you want to use it.</li>
  <li>Press the button saying 'Rerecord' to repeat the process!!</li>
</ol>
</p>
<p>(Don't forget to allow the use of the microphone!)</p>

<p>Optionally, change the length of the recording: <input type="text" value="1000" id="nr_points_input"> points</p>
<p>Optionally, change the title of the recording: <input type="text" value="ZINECAMP RECORDING" id="title_input"></p>
<button onclick="start_recording()">Start recording</button>
<button onclick="copy_HPGL()">Copy HPGL output</button>
<button onclick="clear_HPGL()">Rerecord</button>

<p id="output-p">(HPGL code will appear here)</p>

</body>

<script>

var noise_values = [];
var nr_points = 1000;
console.log(nr_points);

var start = 0.0;
var end = 0.0;

function start_recording() {
  nr_points = document.getElementById("nr_points_input").value;
  if (start == 0.0) start = Date.now();

  // capturing template taken from https://stackoverflow.com/questions/52097840/how-to-overwrite-text-in-p-tag-using-javascript
  navigator.mediaDevices.getUserMedia({
    audio: true,
    video: true
  })
    .then(function(stream) {
      const audioContext = new AudioContext();
      const analyser = audioContext.createAnalyser();
      const microphone = audioContext.createMediaStreamSource(stream);
      const scriptProcessor = audioContext.createScriptProcessor(2048, 1, 1);

      analyser.smoothingTimeConstant = 0.8;
      analyser.fftSize = 1024;

      microphone.connect(analyser);
      analyser.connect(scriptProcessor);
      scriptProcessor.connect(audioContext.destination);
      scriptProcessor.onaudioprocess = function() {
        const array = new Uint8Array(analyser.frequencyBinCount);
        analyser.getByteFrequencyData(array);
        const arraySum = array.reduce((a, value) => a + value, 0);
        const average = arraySum / array.length;
        noise_values.push(Math.round(average));
        if(noise_values.length >= nr_points) {create_output(); return;}
        console.log(Math.round(average));
        // colorPids(average);
      };
    })
    .catch(function(err) {
    console.error(err);
  });

}

function create_output() {

    console.log(noise_values[0]);

    var output = "IN;SC0,100,0,100;PU;DT$;SI0.2,1;";

    if (end == 0.0) end = Date.now();
    output += "PA2,90;LB" + document.getElementById("title_input").value + ":$;";
    output += "PA2,80;LBstart recording at: " + start + "$;";
    output += "PA2,70;LBend recording at:   " + end   + "$;";
    output += "PA2,60;LB(seconds after Unix Epoch)$;";

    for (var x = 0; x < nr_points; x += 1) {
      output += "PA"+ (x/10) + "," + noise_values[x] + ";PD;\n";
    }
    output += "PU;";
  //  console.log(output);

   document.getElementById("output-p").innerText = output;

  }

// inspired by https://www.w3schools.com/howto/howto_js_copy_clipboard.asp
function copy_HPGL () {
    // Get the text field
    var copyText = document.getElementById("output-p");
    // Copy the text inside the text field
    navigator.clipboard.writeText(copyText.innerText);
    // Alert the copied text
    alert("Copied the text: " + copyText.innerText);
  }

function clear_HPGL() {
    noise_values = [];
    start = 0.0;
    end = 0.0;
    nr_points = document.getElementById("nr_points_input").value;
    document.getElementById("output-p").innerText = "";
  }

  </script>

</html>
Complot
Through incantations in the forms of ".hpgl"-files and chiplotle3 set up in a virtual environment (don't ask me why, it just happened to work out for all parties involved (why do it easy when you can do it hard?)). bridging the generational gap between my now state-of the art computer with the then state of the art pen plotter a series of adapters are engaged: from the plotter a custom parallel port to serial converter is connected to a USB to RS232 DB9 Serial Adapter Cable, which in turn is connected to a USB to USB-C adapter which plugs into the laptop. Allowing the two machines converse over a plate of chiplotle3. This gave me the opportunity to command the mechanical arm wielding the pen.
After getting to know each other I realized something was not as it should. The pen plotter would stop midway and the yellow(some would even say orange) light, labeled "error" would start blinking. A mangled piece of characters and numbers would then appear in the terminal window, maybe a cry for help, or an apology from the plotter, suggesting we try things differently.
To get back in the plotting saddle chiplotle and the machine must be restarted (in the reverse order). Sometimes the machines also need to be disconnected and reconnected (some personal space is always helpful). Even after all these steps there is a risk of the machine immediately go back in the same catatonic error-state, when asked to plot something new. maybe I should have listened more carefully to the warnings of "alignment issues" and "craps out midway"?
After repeating this choreography for hours I made som observations:
1. The machine seemed to stop randomly every time, even when the same plot was attempted.
- this may suggest that the issue was rather of a mechanical-nature as opposed to to electrical/software-related.
2. Smaller plots were more reliably plotted.
- This may suggest that the issue was related to movement, as the bigger the plot, the more movement the more likely to error the machine was.
3. For some plots there were some specific regions/lines where the plot would fail, I noticed a pattern that these were usually lines that were parallel to the long edge of the paper.
- This may suggest that the issue was related to the movement of the paper. (The machine plots in an Cartesian coordinate system, where the movement of the pen gives moves it through one axis (let's say "y") and a roller moves the paper in the other axis (let's say "x")).
Based on these observations I formed a hypothesis that the reason the plotting machine stumbled, was the fact that like most old things their agility declines, affecting how certain task can and/or can't be performed. More specifically that it stops because its ability to move paper in the "x-axis" was compromised. To further test this hypothesis I tried to move the roller that is supposed to move the paper, when it had errored. To my (not so?)surprise it seemed stuck, and I could just barely move it with the application of force. (I have to note that this was not a pleasant experience, as for all I knew this could really damage the machine, but desperate times – desperate means (or something). At this point I knew ish what was wrong, that the machine struggles with moving the paper, but I did not have the courage or knowledge to act upon the discovery and "repair" the machine. It was still able to plot the line on the paper, so maybe I was the one who needed to change?
In order to plot I was required to be more considerate of the needs and quirks of this specific pen plotter. So how could this be achieved? I needed to reduce the amount of movement in the x-axis as much as possible. To accomplish this I constructed graphics made of lines only in one axis. This was done with image-manipulation software the likes of GIMP or Inkscape. By separating different color channels, or different leves of lightness/darkness in an image or drawing, and then making these layers into shapes with a threshold, and use the outlines of the shapes to mask a layer of parallel digitally constructed vector-lines. This strategy proved effective, and the amounts of errors was greatly reduced.
A new challenge appeared after this technique was implemented. The fact that the machine still would fail, made it so for certain plots it would never reach the end of a plot even after many tries. When you restart the plot it starts from the beginning again, putting the plotter and plot-operator in a sisyphusian position, of never reaching the end of a plot. A work-around for this was for in the event of an error to manually remove the code that was already plotted in the hpgl file. For this one has to know what you can safely remove from the hpgl file without corrupting it, and a good sense of the nominal relation between lines plotted and lines to plot, and their coded incarnation on the computer (If it looks like half the image is plotted remove about half of the hpgl code(maybe a little less, just to be sure)).
After developing this understanding relationship with the plotter I was able to consistently plot as long as a I adhered to the negotiated protocols. In it´s limitations layed vaste opportunities to be explored.
The plotter did only know how to hold very odd and specific pens. Fortunately any pen plotter can hold any pen with a little bit of tape and tac-it (not verified) all you do is stick it to one of the odd and specific pens. In this process one has to careful as so the tip of the desired drawing-utensil lines up with the tip of the undesired odd and specific pen. Thus ensuring the right amount of pressure. A byproduct of this is that you get a trippy and cool shadowed effect, since there are now two pens drawing rather than one. If this is not to your liking you can use an empty odd and specific pen, or dissect an unused odd and specific pen and remove the "drawing-parts".

Horse drawings made to line art
Now equipped with all the tools explore a lot of shapes and colors together with the HP 7475A, all I needed was some content to plot. All of these events unfolded in a time where drawing horses felt important to me, therefore I had received a Swedish children's book about horses from my sister as a gift, to help me in my horse-studies. The book contained a small tutorial on how to draw a horse, whilst still suggesting that horses can be drawn in many ways, and one should find explore your own way to draw a horse. Rather than to confine to some horse-drawing-paradigm established by the shadow society. This passage of the book moved me, and I had an urge to share this wisdom. Thus I recreated this drawing tutorial in plotted form. Following the tutorial myself drawing digitally. This step by step tutorial covers one side of a A3 sheet and the other is filled with collages of different horse-drawings I have made plotable, varying the colors and motives, creating "unique" prints, that still confine to the same logic and share the same mythos.
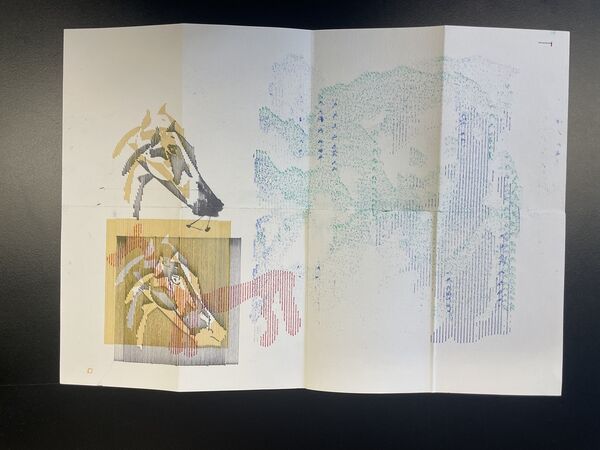
the passage from the Swedish childrens book plotted
Crosshatching experiments
Inspired by https://hackaday.io/project/20585-upgrade-for-your-diy-plotters, Victor and Thijs wanted to do some crosshatched plots. They wrote a processing script to convert images to crosshatched versions. By doing this for any image's different CMYK color channels separately, it is possible to create intricate multicolor plots.
A workflow for this technique can be found here: here
[EXAMPLES WILL BE ADDED LATER TODAY :)]
Crosshatching is a drawing technique for shading by stacking multiple layers of parallel lines. This page describes a workflow to transform a digital image to a crosshatched version.
Find the code on GitHub.
Crosshatching code
Usage
EtherPatches is easy to use. It supports batch conversion: the program automatically converts everything in the input directory and saves the patched works to the output directory.
A step by step guide to EtherPatch your own pads is presented below. Setting up processing on your machine and obtaining the files (steps 1 and 2) need to be done only once.
- To crosshatch your own images, you'll need to be able to compile a Processing file. For this, there are several options:
- The easiest is downloading the Processing IDE
- You can also compile from the command line
- Your favorite IDE might offer plugins for Processing language and compilation support, like this one for vscode
- Next, you need to obtain the code. Again, there are several options:
- Go to https://github.com/Nyxaeroz/Crosshatching, press the button that says code, download the zip and unzip it wherever you want this project to reside on your machine.
- Moving to your desired location and use the following command in a terminal to clone the repository:
git clone https://github.com/Nyxaeroz/Crosshatching.git
- Follow the steps presented in README.md:
- Choose an image to crosshatch and save it into the same folder as hatcher.pde.
- Consider the image dimensions. As the crosshatched version usually won't require a high fidelity image, a high resolution will just increase runtime. Consider changing the dimensions to fit within 1000x1000px.
- Open
sketch.pde - Change the variable
input_name(line 4) to match your input file's name. - Change the variables
input_width(line 11) andinput_height(line 12) to the dimensions of your file. - Change
size(W,H)(line 18) such that W and H are the width resp. height of your file. - Run the program.
- The output will be shown, and the seperate svg layers will, by default, be saved to a folder output_layers.
Parameters
Several parameters may be altered to achieve different results. In particular:
int nr_layers(line 6): the number of crosshatch-layers to be used.int v_line_offset(line 8): the space between two lines within one crosshatch-layerfloat blur-radius(line 9): because, often, we don't want the smallest details to appear in our crosshatch, we apply a Gaussian blur. This radius determines it's size. A size of 0 can be used to not use a blur.boolean save(line 14): the program will save the layers if and only if 'save' is set to true. Not saving would still display the image, and is useful e.g. in tweaking the parameters.
Notes
Though the layers are saved as svg, in actuality these svgs contain images... At the moment, it is advised to use other programs to convert this to actual vector layers.
Plotting
This software was created when working with penplotters. The general workflow of penplotting a crosshatched image consists of 3 steps:
- Select an image and convert it to crosshatches using a Processing sketch (find the code on GitHub).
- Use Inkscape to trace the output, and convert it to HPGL.
- Plot the HPGL file (for guides, see here).
A full workflow can be found on this dedicated project page.

