User:Zpalomagar/PROJECTOVERVIEW: Difference between revisions
Zpalomagar (talk | contribs) |
Zpalomagar (talk | contribs) |
||
| (10 intermediate revisions by the same user not shown) | |||
| Line 14: | Line 14: | ||
=Where was I? (pre-covid)= | =Where was I? (pre-covid)= | ||
==Counter-meetings== | |||
During the months of January and February I had serveral meetings and talks with people related with communities to work with in the city of Rotterdam. From this meetings I extracted different strategies to participate with them and a potential index of maps to develop. | |||
Main Counter-meetings: Melle Smets, Kamiel Verschuren, Michelle Teran, Piet Vollssrd etc. | |||
==Mapahton== | |||
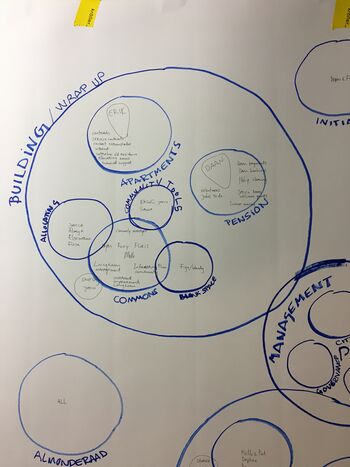
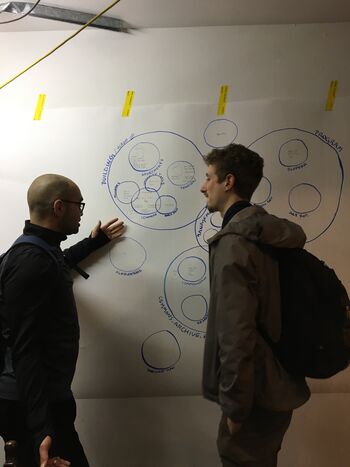
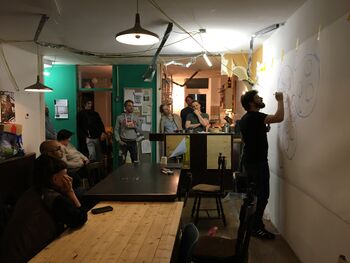
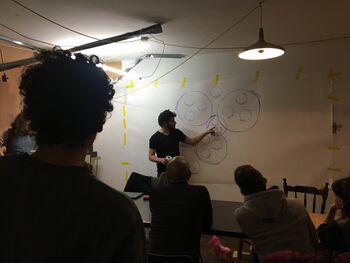
During February, I started planning social events to start mapping under the name of “marathon sessions” Just one mapping session took place in Stad in de Maak. We started a collective map that was the draft of the sociocratic diagram. This process has been shifted to an online approach on how to collect data and achieve participatory collaboration in the process of map-making. | |||
[[File:Mapathon01.JPG|350px|thumb|center|Mapathon]] | |||
[[File:CE_Mapathon1.JPG|350px|thumb|center|Mapathon]] | |||
[[File:CE_Mapathon2.JPG|350px|thumb|center|Mapathon]] | |||
[[File:CE_Mapathon3.JPG|350px|thumb|center|Mapathon]] | |||
==Maps and space== | |||
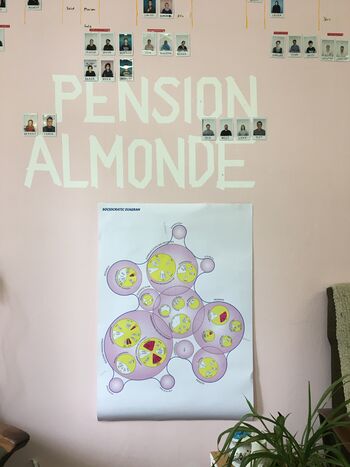
[[File:Sociocracypensionalmonde.JPG|350px|thumb|center|Sociocracy Map in Pensoin Almonde]] | |||
==Feedback/Outputs== | |||
Before the COVID explosion, I was exploring how to be able to carry out feedback sessions or outputs for the map that would allow me to carry out social activities through the map element. This type of activity could only be started with one of the maps (the sociocratic diagram) whose plan was to be printed in a large format and allow users to physically leave their comments there and update it every two weeks. Unfortunately, this only happened in the initial impression from now on the process has also become a virtual follow-up. | |||
=Where am I? (post-covid)= | =Where am I? (post-covid)= | ||
==Map digitalization== | |||
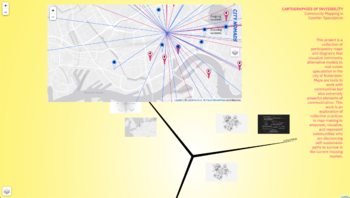
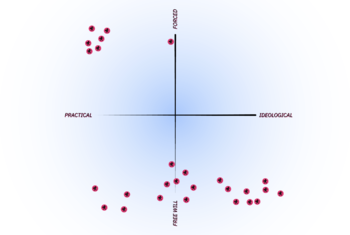
Since social gatherings are not possible, the project has become a digital interactive display of the map collection. Currently, I am working on finding the right narrative to have a practical and pleasant approach to the collection, understanding the main questions that the project tries to answer. The maps are organized in a three-axis diagram in which they are positioned according to their treatment of economic, social and political issues. This organization aspires to be the access platform through which the reader's exploration begins. | |||
[http://82.169.88.92/COUNTERSPECULATION/INDEX/INDEX%20COUNTER%20SPECULATION.html MAP INDEX HERE] | |||
[[File:Indexscr01.png|350px|thumb|center|Index screenshot]] | |||
==Working with Leaflet== | |||
Since I started integrating all content digitally, I have established leaflet as my content display tool. I am doing all the maps exploring the possibilities of adding graphic elements in the leaflet library, integrating shapes made with design programs or customizing the available graphic elements. The project talks about counter cartography; all the maps I make are an act of counter-mapping following different strategies. Leaflet library has allowed me to explore both geographic maps and maps that have any other type of base using the representative space variable in the map as a canvas to start designing on. | |||
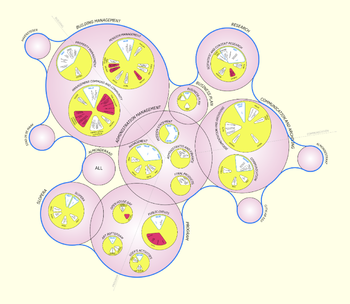
[[File:diag01.png|350px|thumb|center|Sociocratic diagram]] | |||
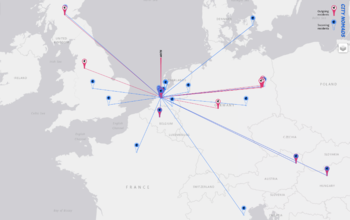
[[File:diag02.png|350px|thumb|center|Geo nomad map]] | |||
[[File:diag03.png|350px|thumb|center|Motivational diagram]] | |||
==Virtual Feedback== | |||
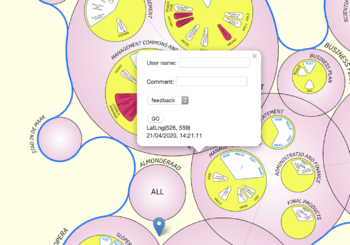
During the last weeks, I have been working in the integration of comments into the map collection. The maps are currently stored in a home server, so I would like to accumulate comments in this server as well in the format of a JSON file. Therefore, the user can read and navigate through the different maps. Moreover, if you click anywhere, you can leave a comment marker that would be stored in the JSON file and display when you visit the map in the future. This tool, which is in a very advance stage of prototyping, will allow me to collect spontaneous feedback but also to be able to ask for peer to peer reviews and other types of participatory reactions. | |||
[[File:virtualfeedback01.png|350px|thumb|center|Virtual Feedback]] | |||
Latest revision as of 10:36, 23 June 2020
Project Statement
CARTOGRAPHIES OF INVISIBILITY
Community mapping in Counter-Speculation
This project is a collection of participatory maps and diagrams that visualize community alternative models to real estate speculation in the city of Rotterdam. Maps are tools to work with communities but also extremely powerful elements of communication. This work is an exploration in collective practices in map-making to empower, visualize, and represent communities who are discovering self-sustainable paths to survive in the current housing market.
Cartographies, maps, and diagrams have traditionally been elements of power and domination. Still, since maps became popular and accessible to the general public, we have the chance to reverse the process, creating counter-maps which can fill gaps in map representation. As an architect, I have always had close contact with the real estate market, and I have developed a particular interest in the social consequences of its current situation and potential variations. Furthermore, growing up in Europe, I have seen with great frustration how the economy and social rights were devoured by major crises with their origin in real estate speculation. The social consequences of this speculation can be pernicious to society if there is no awareness of its impact, such as gentrification, exclusion of the housing market, redlining, etc. but this does not appear on the “official” housing maps. They proudly show how house prices increase to appear that the economy is growing every day and trying to frame the perfect moment to invest in the most valuable property. We have hundreds, thousands of maps representing real-state market, but we have to wonder, are these the maps the ones that we want? This experimental collection of maps tries to answer the main question: How do communities originate alternatives to survive in an unstoppable house speculation market?
To produce this maps collection, I’m working with three communities in Rotterdam (Stad in de Maak, N.A.C, and Poortgebow) that are developing distinctive paths in housing urban market. In constant interaction with them, I’m producing maps to visualize its political, economic, and social approach to understand their position and relation with the city. The production of maps had the first approach with map-making sessions together. But, since we cannot use the space to carry out group activities, this has also become an opportunity to explore online interaction with participants through virtual tools.
Cartographies of Invisibility is a project developed in the city of Rotterdam but with the ambition to be read as a global strategic manual. This collection of maps visualize and understand practices that are happening everywhere. Therefore they can be understood as tactical maps to inspire, reproduce and guide some other communities that are part of this global process in any other place or city.
Where was I? (pre-covid)
Counter-meetings
During the months of January and February I had serveral meetings and talks with people related with communities to work with in the city of Rotterdam. From this meetings I extracted different strategies to participate with them and a potential index of maps to develop.
Main Counter-meetings: Melle Smets, Kamiel Verschuren, Michelle Teran, Piet Vollssrd etc.
Mapahton
During February, I started planning social events to start mapping under the name of “marathon sessions” Just one mapping session took place in Stad in de Maak. We started a collective map that was the draft of the sociocratic diagram. This process has been shifted to an online approach on how to collect data and achieve participatory collaboration in the process of map-making.
Maps and space
Feedback/Outputs
Before the COVID explosion, I was exploring how to be able to carry out feedback sessions or outputs for the map that would allow me to carry out social activities through the map element. This type of activity could only be started with one of the maps (the sociocratic diagram) whose plan was to be printed in a large format and allow users to physically leave their comments there and update it every two weeks. Unfortunately, this only happened in the initial impression from now on the process has also become a virtual follow-up.
Where am I? (post-covid)
Map digitalization
Since social gatherings are not possible, the project has become a digital interactive display of the map collection. Currently, I am working on finding the right narrative to have a practical and pleasant approach to the collection, understanding the main questions that the project tries to answer. The maps are organized in a three-axis diagram in which they are positioned according to their treatment of economic, social and political issues. This organization aspires to be the access platform through which the reader's exploration begins.
Working with Leaflet
Since I started integrating all content digitally, I have established leaflet as my content display tool. I am doing all the maps exploring the possibilities of adding graphic elements in the leaflet library, integrating shapes made with design programs or customizing the available graphic elements. The project talks about counter cartography; all the maps I make are an act of counter-mapping following different strategies. Leaflet library has allowed me to explore both geographic maps and maps that have any other type of base using the representative space variable in the map as a canvas to start designing on.
Virtual Feedback
During the last weeks, I have been working in the integration of comments into the map collection. The maps are currently stored in a home server, so I would like to accumulate comments in this server as well in the format of a JSON file. Therefore, the user can read and navigate through the different maps. Moreover, if you click anywhere, you can leave a comment marker that would be stored in the JSON file and display when you visit the map in the future. This tool, which is in a very advance stage of prototyping, will allow me to collect spontaneous feedback but also to be able to ask for peer to peer reviews and other types of participatory reactions.

