User:Zpalomagar/ATLAS: Difference between revisions
Zpalomagar (talk | contribs) No edit summary |
Zpalomagar (talk | contribs) |
||
| (15 intermediate revisions by the same user not shown) | |||
| Line 1: | Line 1: | ||
==Speculative Atlas== | ==Speculative Atlas of counter-cartographies== | ||
This is the beginning of an experimental cartography collection that amplify anti-gentrification voices in the city of Rotterdam. It is a space to collect, process and visualises data and information that are lost online and offline and express people feelings about house speculation. Big data is starting to be too big to be processed and a lot of information is buried in huge datasets. Therefore, I’m going to experiment with the construction of small social data sets coming from real voices far away from statistic models. Densifying cities doesn’t have to imply a negative connotation but it is if voices that are against densification models and urban plans are silenced and misrepresented. As an architect I believe in the importance of working with communities hand in hand in order to build better societies, vulnerable voices deserve a space to be heard. This is a collection of brave cartographies that map resistance, fight and effort to improve the city. | This is the beginning of an experimental cartography collection that amplify anti-gentrification voices in the city of Rotterdam. It is a space to collect, process and visualises data and information that are lost online and offline and express people feelings about house speculation. Big data is starting to be too big to be processed and a lot of information is buried in huge datasets. Therefore, I’m going to experiment with the construction of small social data sets coming from real voices far away from statistic models. Densifying cities doesn’t have to imply a negative connotation but it is if voices that are against densification models and urban plans are silenced and misrepresented. As an architect I believe in the importance of working with communities hand in hand in order to build better societies, vulnerable voices deserve a space to be heard. This is a collection of brave cartographies that map resistance, fight and effort to improve the city. | ||
===Testimonial Map=== | ===Testimonial Map=== | ||
[[File:Testimonialmap1.png|350px|thumb|center|Testimonial Map]] | |||
People talk all the time, expressing opinions, claims, suggestions, potential improvements but if nobody track these testimonies they get lost. This experiment has its goal to track the testimonies that are already online where citizens express resistance about gentrification processes in the city of Rotterdam and transform them into a map that represents their perception. The project had also its goal in working with manageable datasets, so the testimonies found online are archive in a CVS file, which is easily open with a wide variety of software to manage data tables and is transformed with D3 javascript library in order to translate the data that I’ve collected into a visual map. This map has also been an exploration in the importation of cvs data to d3 and the possibilities of using this data as visual variables. In the data set created for this testimonial map, some additional information is also registered such as the age, the date and the font of the comment or person the said it. The age is used as a variable for the font text, people who are older is represented with a bigger text reverting the fact that they are usually less present online and their opinion is lost on the internet rapidly. The age is also using as a variable the more recent comment is on the top and are ordered by date. This is an unfinished map that represents the current feeling of a community but the old thoughts are also present as in a timeline where the oldest part is merging with the background but it’s always present in the map. | |||
<source lang="html4strict"> | |||
<!DOCTYPE html> | |||
<html> | |||
<head> | |||
<meta charset="utf-8"> | |||
<title>TESTIMONIAL MAP</title> | |||
<script src='https://d3js.org/d3.v3.min.js'></script> | |||
</head> | |||
<body> | |||
<div id = "help" style="position:relative;"> | |||
</div> | |||
<script> | |||
d3.csv("testimonymap_O.csv", function(data) { | |||
console.log(data); | |||
var canvas = d3.select("body") | |||
.append("div"); | |||
canvas.selectAll("div.text") | |||
.data(data) | |||
.enter() | |||
.append("div") | |||
.attr("class","text") | |||
.attr("title",function(d) {return d.WHO}) | |||
.on("mousemove", function(d){ | |||
var c = d3.mouse(this)[0]; | |||
console.log(this,c); | |||
d3.select("#help").text(d.WHO).style("top", d3.event.pageY +"px") | |||
}) | |||
.style("font-size",function(d){return d.AGE + "px";}) | |||
.text(function(d) {return d.WHAT + " " + d.YEAR;}) | |||
.sort(function(x,y){ | |||
return d3.ascending(x.YEAR, y.YEAR); | |||
}) | |||
.style("margin-top", function(d, i) { return i * 20 + 10 + "px";}) | |||
canvas.selectAll("div.text") | |||
.filter(d => !d.YEAR).remove() | |||
.filter(d => !d.AGE).remove() | |||
}) | |||
</script> | |||
</body> | |||
</html> | |||
</source> | |||
===Resistance Map=== | ===Resistance Map=== | ||
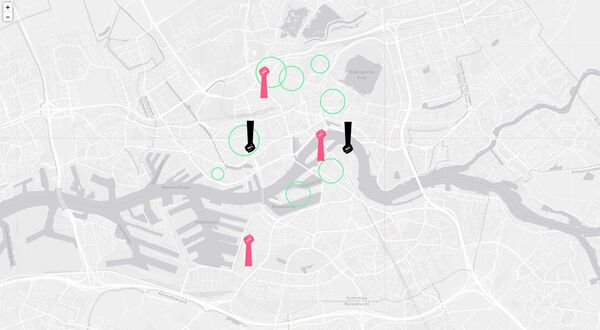
[[File:ResistanceMap.jpg|600px|thumb|center|Resistance Map - Leaflet visualisation]] | |||
This map is based on a geographical approach to resistance communities against gentrification policies in the city of Rotterdam. This visualisation has its goal in extracting geographical links and conclusions about where are people fighting for that and raise awareness about the existence of small communities that don’t want to be kicked out. This map is also registering the movements that took place in the past and they have been defeated. They leave their footprints in the map and visualise the victories of speculation over resistance. | |||
<source lang="html4strict"> | |||
<!DOCTYPE html> | |||
<html> | |||
<head> | |||
<link rel="stylesheet" href="https://unpkg.com/leaflet@1.6.0/dist/leaflet.css" | |||
integrity="sha512-xwE/Az9zrjBIphAcBb3F6JVqxf46+CDLwfLMHloNu6KEQCAWi6HcDUbeOfBIptF7tcCzusKFjFw2yuvEpDL9wQ==" | |||
crossorigin=""/> | |||
<script src="https://unpkg.com/leaflet@1.6.0/dist/leaflet.js" | |||
integrity="sha512-gZwIG9x3wUXg2hdXF6+rVkLF/0Vi9U8D2Ntg4Ga5I5BZpVkVxlJWbSQtXPSiUTtC0TjtGOmxa1AJPuV0CPthew==" | |||
crossorigin=""></script> | |||
</head> | |||
<body> | |||
<div id="mapid" style="width: 100%; height: 1000px;"></div> | |||
<script type="text/javascript"> | |||
var mymap = L.map('mapid').setView([51.91695582709645, 4.45770263671875], 13); | |||
L.tileLayer('https://server.arcgisonline.com/ArcGIS/rest/services/Canvas/World_Light_Gray_Base/MapServer/tile/{z}/{y}/{x}.png', { | |||
attribution: '© <a href="http://osm.org/copyright">OpenStreetMap</a> contributors' | |||
}).addTo(mymap); | |||
var pinkicon = L.icon({ | |||
iconUrl: 'MAPICON.png', | |||
iconSize: [60, 84], // size of the icon | |||
shadowSize: [50, 64], // size of the shadow | |||
iconAnchor: [29, 81], // point of the icon which will correspond to marker's location | |||
shadowAnchor: [4, 62], // the same for the shadow | |||
popupAnchor: [-3, -76] // point from which the popup should open relative to the iconAnchor | |||
}); | |||
var marker = L.marker([51.910391, 4.495962], {icon: pinkicon}).addTo(mymap); | |||
var circle = L.circle([51.934661, 4.48195], { | |||
color: '#00FA9A', | |||
fillColor: 'none', | |||
fillOpacity: 0.5, | |||
radius: 400 | |||
}).addTo(mymap); | |||
var polygon = L.polygon([ | |||
[51.930771, 4.473903], | |||
[51.929461, 4.476392], | |||
[51.929964, 4.477315], | |||
[51.931195, 4.474483] | |||
],{ | |||
color: '#FF1493', | |||
fillColor: '#FF1493', | |||
fillOpacity: 0.5 | |||
}).addTo(mymap); | |||
function onMapClick(e) { | |||
alert("You clicked the map at " + e.latlng); | |||
} | |||
</script> | |||
</body> | |||
</html> | |||
</source> | |||
Latest revision as of 16:38, 4 December 2019
Speculative Atlas of counter-cartographies
This is the beginning of an experimental cartography collection that amplify anti-gentrification voices in the city of Rotterdam. It is a space to collect, process and visualises data and information that are lost online and offline and express people feelings about house speculation. Big data is starting to be too big to be processed and a lot of information is buried in huge datasets. Therefore, I’m going to experiment with the construction of small social data sets coming from real voices far away from statistic models. Densifying cities doesn’t have to imply a negative connotation but it is if voices that are against densification models and urban plans are silenced and misrepresented. As an architect I believe in the importance of working with communities hand in hand in order to build better societies, vulnerable voices deserve a space to be heard. This is a collection of brave cartographies that map resistance, fight and effort to improve the city.
Testimonial Map
People talk all the time, expressing opinions, claims, suggestions, potential improvements but if nobody track these testimonies they get lost. This experiment has its goal to track the testimonies that are already online where citizens express resistance about gentrification processes in the city of Rotterdam and transform them into a map that represents their perception. The project had also its goal in working with manageable datasets, so the testimonies found online are archive in a CVS file, which is easily open with a wide variety of software to manage data tables and is transformed with D3 javascript library in order to translate the data that I’ve collected into a visual map. This map has also been an exploration in the importation of cvs data to d3 and the possibilities of using this data as visual variables. In the data set created for this testimonial map, some additional information is also registered such as the age, the date and the font of the comment or person the said it. The age is used as a variable for the font text, people who are older is represented with a bigger text reverting the fact that they are usually less present online and their opinion is lost on the internet rapidly. The age is also using as a variable the more recent comment is on the top and are ordered by date. This is an unfinished map that represents the current feeling of a community but the old thoughts are also present as in a timeline where the oldest part is merging with the background but it’s always present in the map.
<!DOCTYPE html>
<html>
<head>
	<meta charset="utf-8">
	<title>TESTIMONIAL MAP</title>
	<script src='https://d3js.org/d3.v3.min.js'></script>
</head>
<body>
	<div id = "help" style="position:relative;">
	</div>
	<script>

		d3.csv("testimonymap_O.csv", function(data) {
		console.log(data);

		var canvas = d3.select("body")
			.append("div");

		canvas.selectAll("div.text")
			.data(data)
			.enter()
				.append("div")
				.attr("class","text")
				.attr("title",function(d) {return d.WHO})
				.on("mousemove", function(d){
					var c = d3.mouse(this)[0];
					console.log(this,c);
					d3.select("#help").text(d.WHO).style("top", d3.event.pageY  +"px")
				})
				.style("font-size",function(d){return d.AGE + "px";})
				.text(function(d) {return d.WHAT + " " + d.YEAR;})
				.sort(function(x,y){
					return d3.ascending(x.YEAR, y.YEAR);
				})
				.style("margin-top", function(d, i) { return i * 20 + 10 + "px";})

		canvas.selectAll("div.text")
			.filter(d => !d.YEAR).remove()
			.filter(d => !d.AGE).remove()
		})
	</script>

</body>
</html>
Resistance Map
This map is based on a geographical approach to resistance communities against gentrification policies in the city of Rotterdam. This visualisation has its goal in extracting geographical links and conclusions about where are people fighting for that and raise awareness about the existence of small communities that don’t want to be kicked out. This map is also registering the movements that took place in the past and they have been defeated. They leave their footprints in the map and visualise the victories of speculation over resistance.
<!DOCTYPE html>
<html>
<head>
<link rel="stylesheet" href="https://unpkg.com/leaflet@1.6.0/dist/leaflet.css"
integrity="sha512-xwE/Az9zrjBIphAcBb3F6JVqxf46+CDLwfLMHloNu6KEQCAWi6HcDUbeOfBIptF7tcCzusKFjFw2yuvEpDL9wQ=="
crossorigin=""/>
<script src="https://unpkg.com/leaflet@1.6.0/dist/leaflet.js"
integrity="sha512-gZwIG9x3wUXg2hdXF6+rVkLF/0Vi9U8D2Ntg4Ga5I5BZpVkVxlJWbSQtXPSiUTtC0TjtGOmxa1AJPuV0CPthew=="
crossorigin=""></script>
</head>
<body>
<div id="mapid" style="width: 100%; height: 1000px;"></div>
<script type="text/javascript">
var mymap = L.map('mapid').setView([51.91695582709645, 4.45770263671875], 13);
L.tileLayer('https://server.arcgisonline.com/ArcGIS/rest/services/Canvas/World_Light_Gray_Base/MapServer/tile/{z}/{y}/{x}.png', {
attribution: '© <a href="http://osm.org/copyright">OpenStreetMap</a> contributors'
}).addTo(mymap);
var pinkicon = L.icon({
iconUrl: 'MAPICON.png',
iconSize: [60, 84], // size of the icon
shadowSize: [50, 64], // size of the shadow
iconAnchor: [29, 81], // point of the icon which will correspond to marker's location
shadowAnchor: [4, 62], // the same for the shadow
popupAnchor: [-3, -76] // point from which the popup should open relative to the iconAnchor
});
var marker = L.marker([51.910391, 4.495962], {icon: pinkicon}).addTo(mymap);
var circle = L.circle([51.934661, 4.48195], {
color: '#00FA9A',
fillColor: 'none',
fillOpacity: 0.5,
radius: 400
}).addTo(mymap);
var polygon = L.polygon([
[51.930771, 4.473903],
[51.929461, 4.476392],
[51.929964, 4.477315],
[51.931195, 4.474483]
],{
color: '#FF1493',
fillColor: '#FF1493',
fillOpacity: 0.5
}).addTo(mymap);
function onMapClick(e) {
alert("You clicked the map at " + e.latlng);
}
</script>
</body>
</html>


