Graphviz (Wordhole): Difference between revisions
(Change header sizes) |
m (Change a header's size) |
||
| (One intermediate revision by the same user not shown) | |||
| Line 14: | Line 14: | ||
===In context=== | ===In context=== | ||
* 'I have used Graphviz to visualize the connections between the items of the glossary on this special issue.' | * 'I have used Graphviz to visualize the connections between the items of the glossary on this special issue.' | ||
===Example=== | ===Example=== | ||
| Line 32: | Line 30: | ||
} | } | ||
</syntaxhighlight> | </syntaxhighlight> | ||
==Images and links== | ===Images and links=== | ||
https://graphviz.org/ | https://graphviz.org/ | ||
Latest revision as of 15:55, 1 November 2023
This is an entry for 'Graphviz' for the Wordhole Glossary.
Definitions
- Graphviz is a package of open source tools initiated by AT&T Labs Research for graph visualization. The name is a stylized contraction of 'graph visualisation software', i.e. software that provides a way of representing structural information as diagrams of abstract graphs and networks. It uses DOT Lanugage scripts. (From Graphviz and Wikipedia)
Application (as used by us)
Graphviz has been used to create graphs, for example in an attempt to visualize different questions on archives (see pad of 2023-10-10).
Application (other contexts)
See https://en.wikipedia.org/wiki/Graphviz#Applications_that_use_Graphviz.
In context
- 'I have used Graphviz to visualize the connections between the items of the glossary on this special issue.'
Example
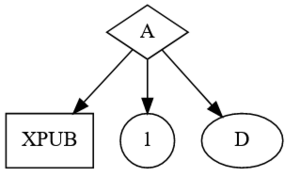
digraph D {

  A [label="Hello" shape=diamond]
  B [label="XPUB" shape=box]
  C [label="1" shape=circle]

  A -> B
  A -> C
  A -> D

}

