User:Simon/Special Issue 8/summary second half trim: Difference between revisions

From XPUB & Lens-Based wiki
 
(42 intermediate revisions by the same user not shown)
Line 1: Line 1:
=Visualising network topologies=
__TOC__
<br>
=First half: Mapping network topologies=
==paul baran diagrams==
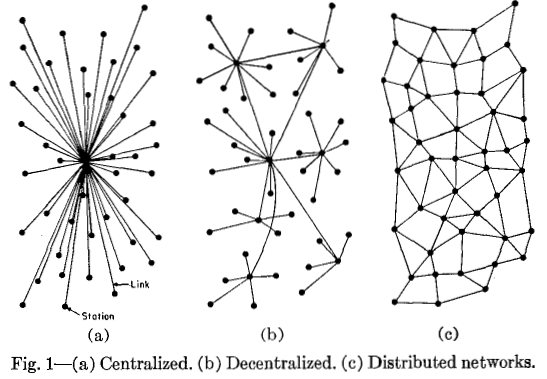
We started with a reading of a text on centralised, decentralised, and distributed networks that included a diagram made by Paul Baran for the RAND corporation. This diagram displays classic ways to visualise these networks.
 
[[File:Networktypes.png|On Distributed Networks, 1964, Paul Baran, diagram for RAND research memoranda 3420]]
 
==dependency mapping task==
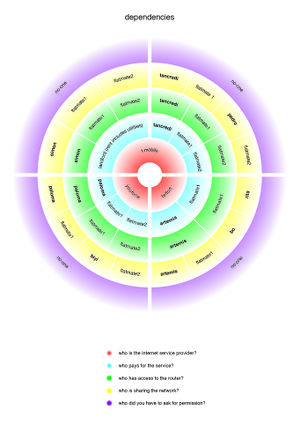
As part of the Infrastuctour, when we set up our homeservers, I worked with Artemis to create a visualisation of the dependencies involved setting them up.
 
[[File:19 01 20 dependencies.jpg|frameless]]
 
==physical map in XPUB studio==
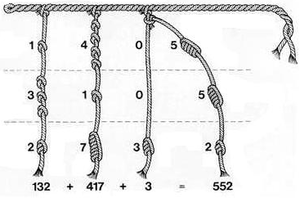
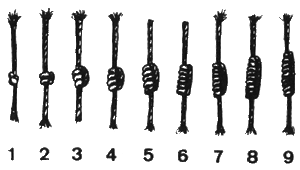
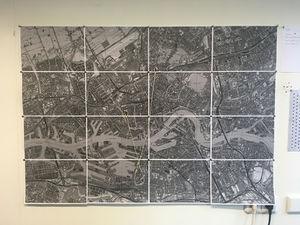
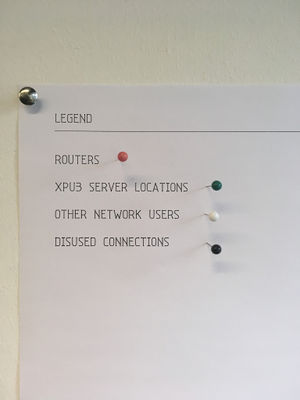
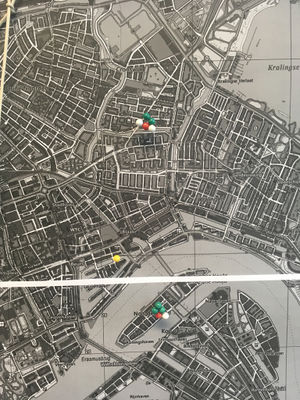
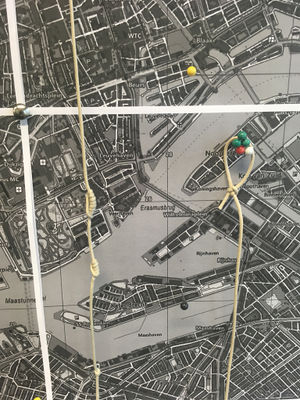
I made a map of the location of homeservers and routers, including the other (non-XPUB) network users as well as situations where it was not possible for XPUB students to connect their server to their home router, and so had to depend on others. Manetta introduced me to Inca Quipu, a way that the Inca recorded numbers by tying knots in strings.
 
[[File:Paint3.png|frameless]]
[[File:Quipu 4 incas.gif|frameless]]
 
I connected a piece of string I'd tied knots in to represent my external IP address for my home server, as a way to visualise the idea of connecting and also the route that a client follows when connecting to my website, which is in reverse from the way I would display my IP.
 
[[File:map 7914.JPG|frameless]]
[[File:map 7915.JPG|frameless]]
[[File:map 7916.JPG|frameless]]
[[File:map 7918.JPG|frameless]]
 
==collection of texts==
I began collecting relevant texts to my research and creating html pages to store them on my website. This has been a useful way to develop my web design knowledge and skills as well as provide theoretical basis for the research I'm undertaking into network topologies.
<br>
<br>
Tung-Hui Hu: Truckstops on the Information Superhighway<br>
http://b-e-e-t.r-o-o-t.net/pages/truckstops_on_the_information_superhighway.html
 
Paul Rand: Cybernetic Guerilla Warfare (Radical Software 1.3)<br>
http://b-e-e-t.r-o-o-t.net/pages/cybernetic_guerilla_warfare.html
 
R. Buckminster Fuller: Software (Radical Software 1.1)<br>
http://b-e-e-t.r-o-o-t.net/pages/buckminster_fuller_software.html<br>
<br>
 
These texts introduced me to alternative models for mapping topologies such as "klein worms", referred to in both Hui (2015) and Rand's (1970) texts. Klien worms are based on the klein bottle, which falls into the category of "topologically impossible" objects (such as moebius strips etc.).<br>
[[File:Hu-02-ponsot-klein-worms-1971.png|Fig. 2. Klein Worms, 1971, Claude Ponsot, illustration for Paul Ryan, “Cybernetic Guerilla Warfare,” in Radical Software 1:3]]
 
==Paranodal activity==
The concept of paranode (as suggested in Constant's Feminist Server Manifesto, and further explored by Zach Blas) was intriguing, and I resolved to keep this in mind when mapping network topologies. I see the paranode as both a disruptive concept (the thing that isn't there?), also not related to physical devices (established as nodes, but instead on social and conceptual relations between people and the world). I took initial references from the SI concept of the derive as a way to rethink autonomy in public space.
 
On further reading I found this article:<br>
http://www.christydena.com/2007/08/new-network-theory-the-tyranny-of-nodes/
 
The author defines the paranodal in this way: ''the space between nodes; the space that is not dead, but very much alive.''
 
The author also uses Ranciere's terminology, saying: ''the paranodal is "the part of those who have no part", where we experience what it is to be outside of the network while still being related to it.''
 
==maps and autonomy==
I began recording some of my thoughts around the concept of contingent autonomy and how it relates to mapping. These refer to the map/territory problem, which sees a 1:1 map as redundant (and therefore useless) and also Hakim Bey's Temporary Autonomous Zone concept (introduced to me by Tancre), where the 1:1 map is the only possible way for someone to have autonomy.<br>
https://pad.xpub.nl/p/map_thoughts
 
==topology and graphology==
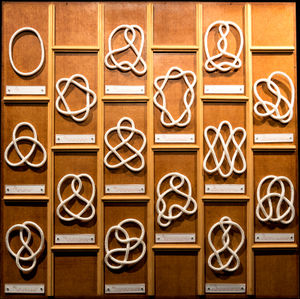
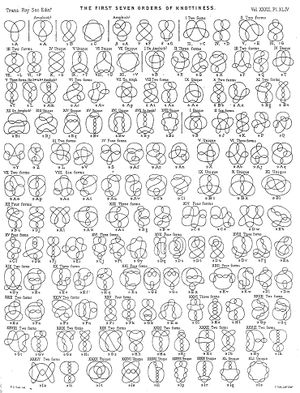
Early references explored knot theory, a study in mathematics which takes knots as topological forms. I found these interesting as alternative models of topology to the one presented by Baran; also as Roel pointed out, the etymology of the word "node" comes from the word for "knot".
 
[[File:Tabela de nós matemáticos 01, crop.jpg|frameless]]
[[File:Tait-On-knots-03.jpg|frameless]]
 
 
Michael introduced me to Jacqueline de Jong's Situationist Times, which I found interesting (particularly Issue 3: Topology).
 
 
My research led me to discover the famous Seven Bridges of Königsberg (now Kaliningrad, Russia) problem, which prefigured topology and laid foundations for graphology (a graphic mapping of topologies). The problem asked how to devise a walk across these bridges, crossing each one only once. This was answered as impossible by Euler, who also demonstrated how the physical landscape could easily be abstracted into a graph.<br>
[https://en.wikipedia.org/wiki/Seven_Bridges_of_K%C3%B6nigsberg Seven Bridges of Konigsberg]
 
[[File:Seven bridges koningsberg.png|frameless]]
 
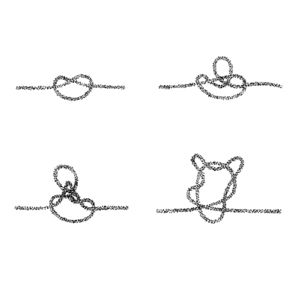
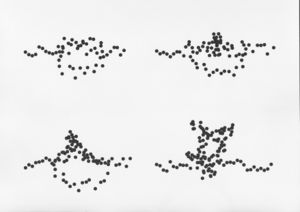
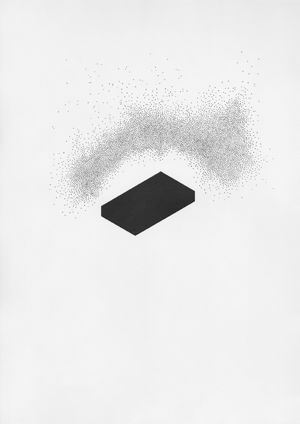
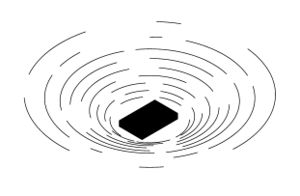
I also began to draw examples of network topologies based on the form of knots that I had explored with making of the physical map. I was interested in how the knots could represent physical, linear movements of data, but when in silhouette, resembled representations of distributed networks.
 
[[File:Dot knots 01.jpg|frameless]]
[[File:19 02 05 big dots knots.jpg|frameless]]
[[File:Router wifi 01.jpg|frameless]]
[[File:Circular signal.jpg|frameless]]
 
==modularity==
I began to make small sculptural models of theoretical network topologies out of polymer clay, which resembled mathematical knots.<br>
[[File:Knot model 01.JPG|frameless]]
 
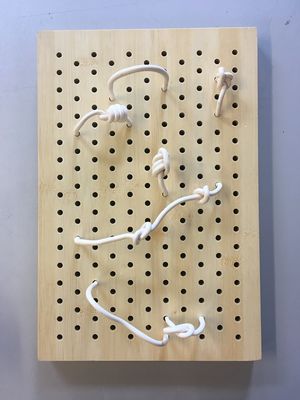
These developed into a model which incorporated a wooden board with regular holes drilled in it, kind of a static interface that these loops and knots could be inserted into, in a similar way to a modular synthesiser. This was partly inspired by a session in which artist Aditya Mandayam demonstrated use of the Plumbutter2, a modular synthesiser that comes with a manifesto and also represents a "map of Baltimore".
 
[[File:Knot board 02.JPG|frameless]]
[[File:Knot board 05.JPG|frameless]]
[[File:Knot board 01.JPG|frameless]]
 
=Second half: Visualising network topologies=


==network of possibilities==
[[File:Network_of_possibilities_hi_res.jpg|800px]]<br>
[[File:Network_of_possibilities_hi_res.jpg|800px]]<br>
<br>
<br>
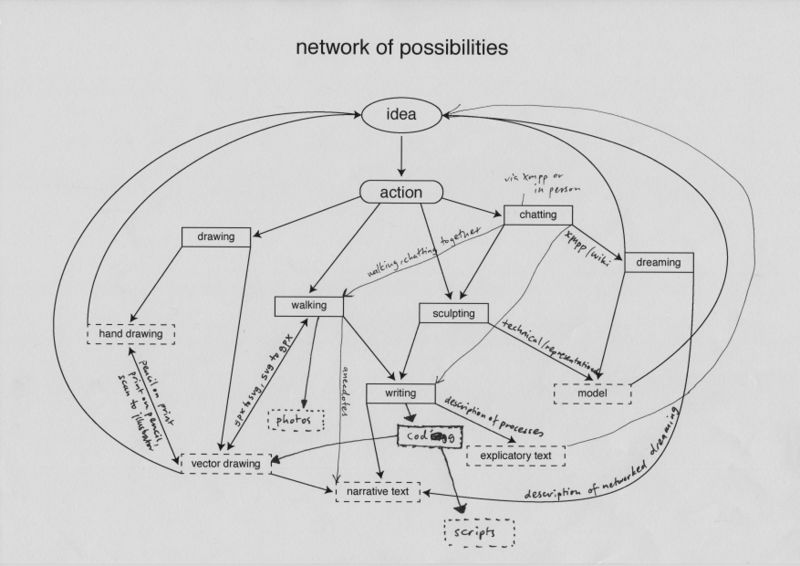
I began the second half of the trimester by determining a networked methodology for producing outcomes. The aim was to develop a heuristic technique which would help me understand networks better through a looped system of ideas, actions and outcomes.
I began the second half of the trimester by determining a networked methodology for producing outcomes. The aim was to develop a heuristic; a technique which would help me understand networks better through a looped system of ideas, actions and outcomes.


==GPS walking==
 
[[File:GPS walking.jpg|800px]]<br>
==gps walking==
[[File:GPS walking.jpg]]<br>
<br>
<br>
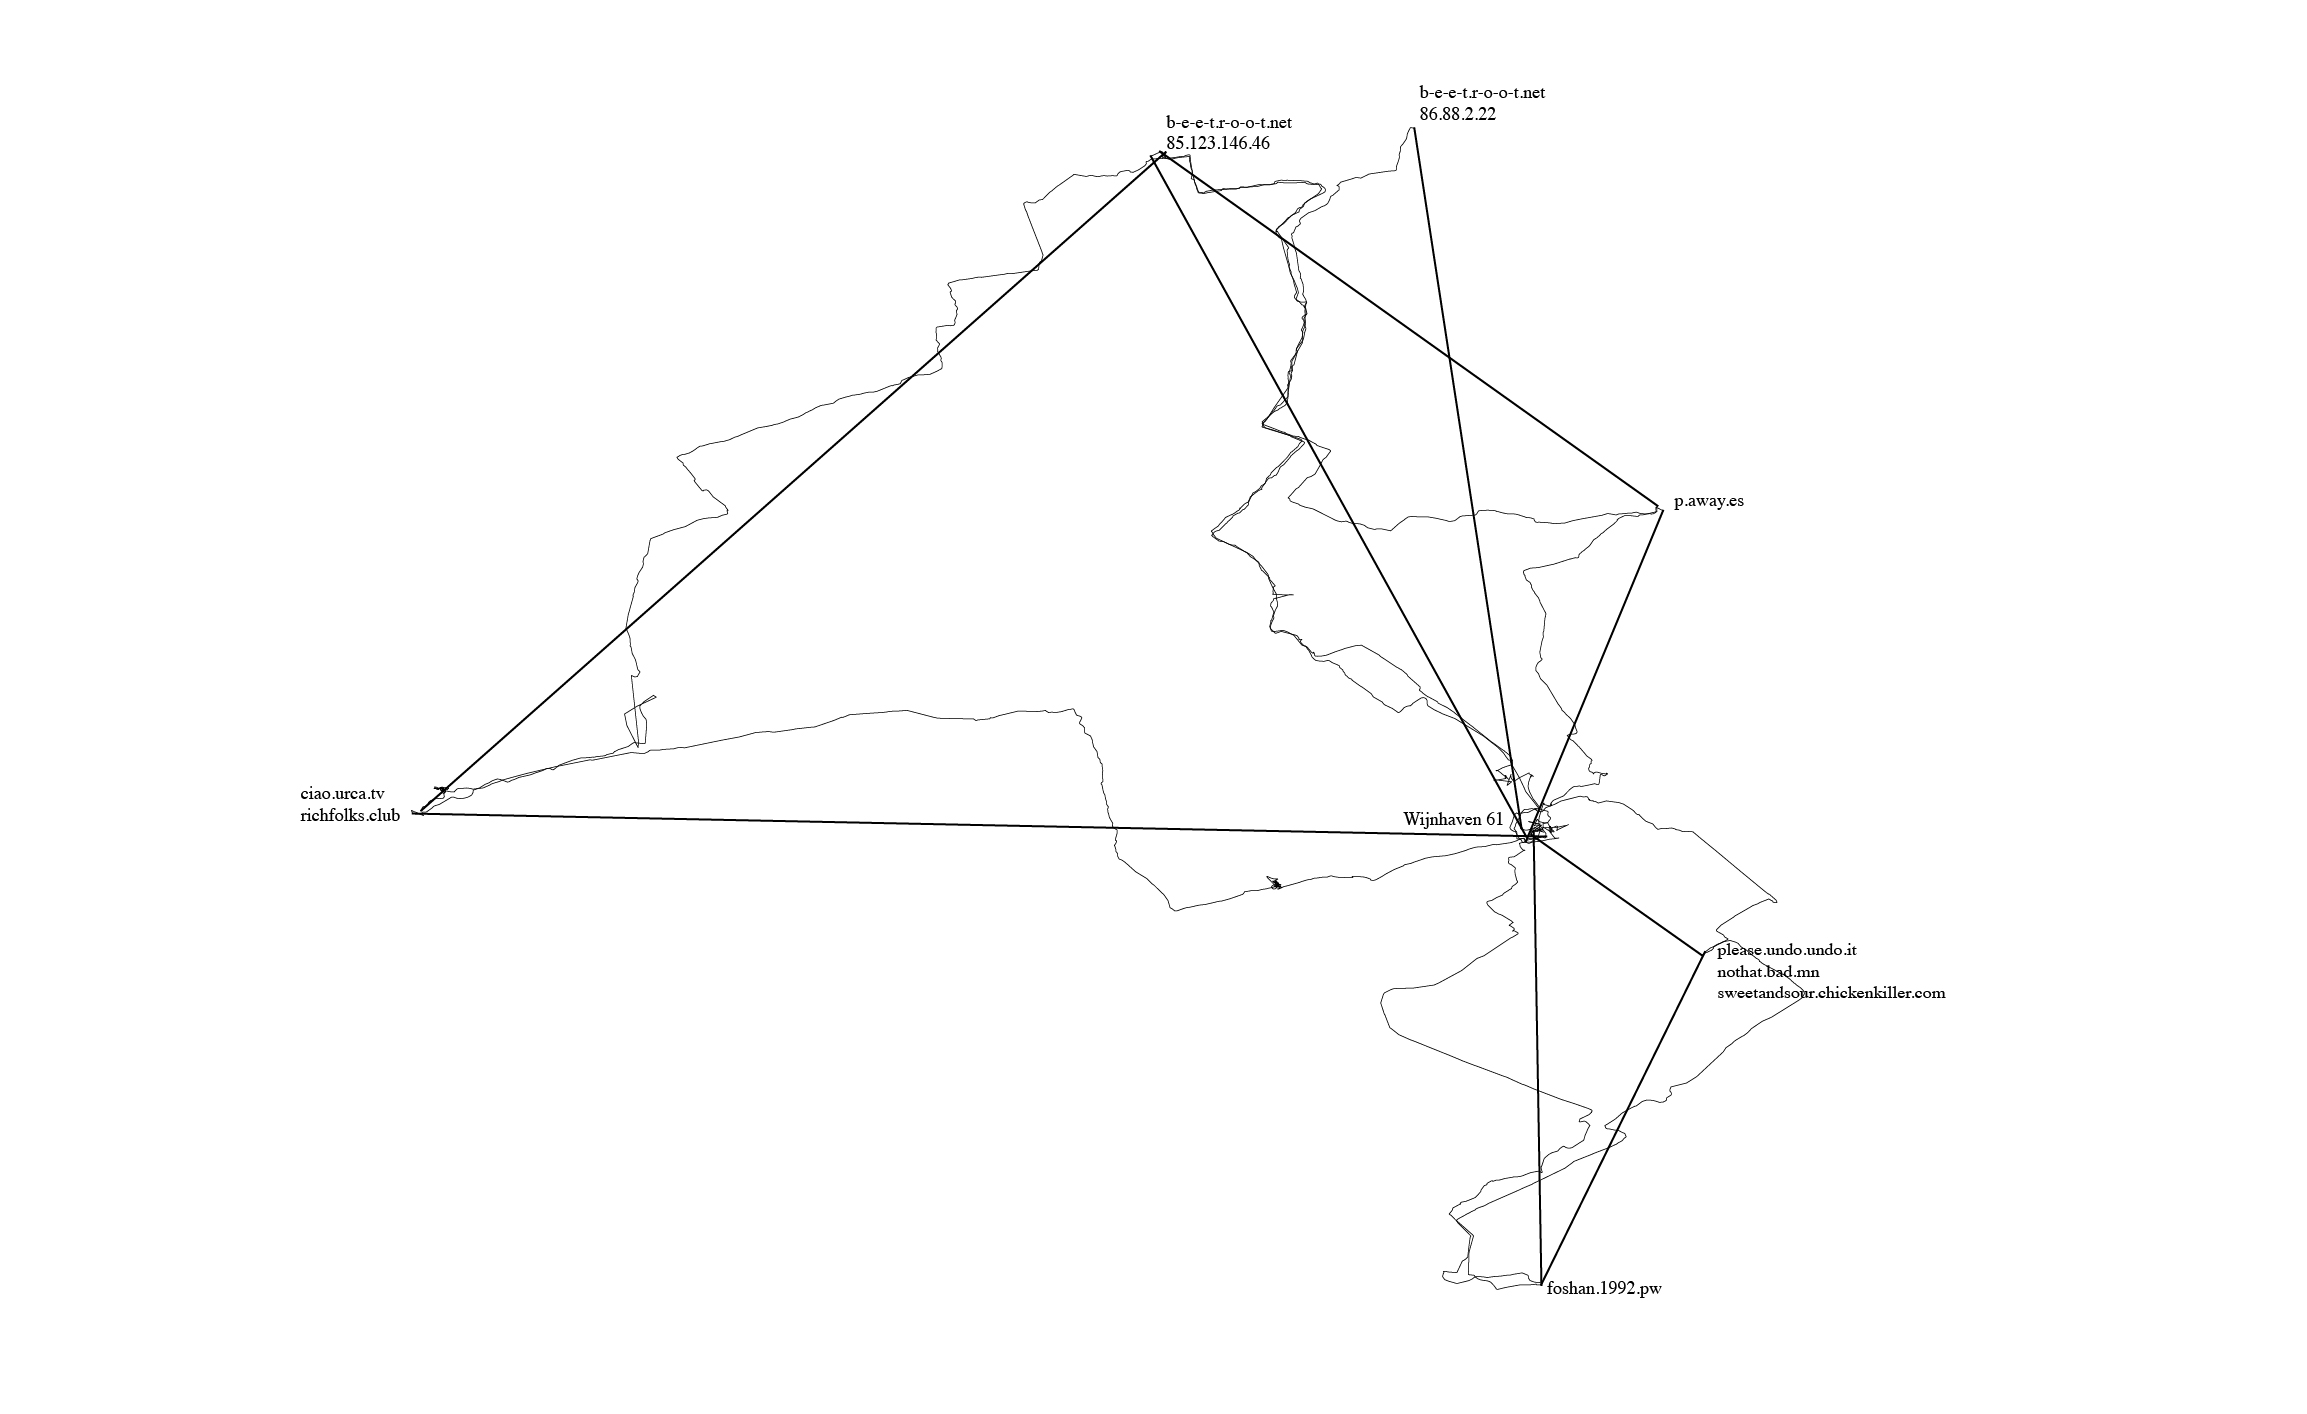
One of the actions I included in my network of possibilities was to begin walking between different points in our network (our homeservers, and also the PZI building where we gathered to have classes and work on Special Issue 08).<br>
Line 48: Line 138:
<br>
<br>


Each walk became an act of drawing (using GPS) and also a meditation.  
Each walk became an act of drawing (using GPS) and also a meditation.


==networked research=
 
==networked research==
I also began to write down my thoughts on various topics that came up.<br>
<code>
[[File:Strips 02.jpg|600px]]<br>
1867
A note from Peter Guthrie Tait scribbled on an envelope asks an unknown recipient "Can't you come on Monday the present at the performance? An elliptical hole gives the rings in a state of vibration!!!"
In a room, thick with smoke, Tait and William Thomson (Lord Kelvin) are conducting an <a class="outOfNetworkLink" href="https://www.youtube.com/watch?v=SwG_uRuYkhg">experiment</a> to test the German physicist Hermann von Helmholtz's theory, that closed vortex lines in a fluid remain stable forever. Tait is using a box that emits smoke made from a pungent mixture of ammonia solution, salt and sulfuric acid. He taps the back of his makeshift vortex cannon, and thick rings he later describes as looking "like solid rings of India rubber" waft from a hole drilled in its front. Thomson develops a theory that each smoke ring is structured around knots in the ether, a space-filling substance believed to transmit matter. Consequently, Tait begins to tabulate possible forms of mathematical knots.


https://pad.xpub.nl/p/networked_research<br>


Abstraction
As I wanted a fairly horizontal structure to my research, I decided to base the content for each page of my website on a walk.
To abstract is to pull or draw away rules and concepts in general from specific examples, first principles, literal signifiers, and other methods. So, abstraction becomes a conceptual process of creating super-categorical representatives for subordinate concepts, connecting related concepts as a group, field or category.


==drawing visualisations==
Drawing (by hand and using vectors) became a large part of the outcomes I produced as part of my research. The drawings often shifted between "hand-drawn" and "computer-drawn", for example, I would use a .svg file made from one of my GPS walks in a vector graphics program, then print it and hand-draw with pencil over the top.<br>


Abstraction layers
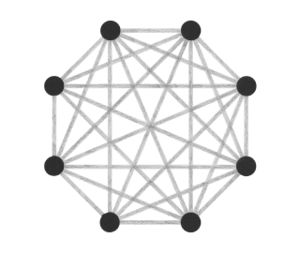
Abstraction became a key interest, and I started to think more about how these different ways of visualising all employed some level of abstraction in order to communicate. This brought me back to the typical idea of displaying network topology, as nodes and straight lines:<br>
<br>
[[File:Star topology wht 640.jpg|300px]]
[[File:Bus wht topology 640.jpg|300px]]
[[File:Ring wht topology 640.jpg|300px]]
[[File:Mesh wht topology 640.jpg|300px]]
<br>


    Computer scientists use abstraction layers to make models that can be re-used and applied widely without having to write code again. For example, using a computer program language allows source code to be translated into machine code which can be used on various different machines. This separates a framework (a categorical concept of writing a program) from specific implementation, thus making the abstraction a categorical concept of the solution.
The drawings I made while GPS walking employed straight lines between trackpoints. However, this was just an abstraction - there are no straight lines in reality. In fact, the more accurately I would be able to map the network, the less useful it would be as a readily comprehensible visualisation. I also noticed that at points the GPS signal had become confused or obscured - this happened when I went into buildings (such as a cafe to buy a coffee) or when the signal might have been obscured by tall buildings around me. This produced knots, which I saw as analogous to nodes.<br>
<br>
[[File:Knot scale times four 640.jpg]]


When I imported the lines I made by GPS walking into .svg format, I experimented with unraveling some of these knots, and then drew this process.<br>
<br>
[[File:Unravelled knot 03 640.jpg]]
[[File:Unravelled knot 02 640.jpg]]
[[File:Unravelled knot 01 640.jpg]]
<br>


    In computer science, an abstraction layer is a generalization of a conceptual model or algorithm, away from any specific implementation. These generalizations arise from broad similarities that are best encapsulated by models that express similarities present in various specific implementations. The simplification provided by a good abstraction layer allows for easy reuse by distilling a useful concept or design pattern so that situations where it may be accurately applied can be quickly recognized.


    A layer is considered to be on top of another if it depends on it. Every layer can exist without the layers above it, and requires the layers below it to function. Frequently abstraction layers can be composed into a hierarchy of abstraction levels. The OSI model comprises seven abstraction layers. Each layer of the model encapsulates and addresses a different part of the needs of digital communications, thereby reducing the complexity of the associated engineering solutions.
==knotboard, knots, knotworks==
Early on in my research into network topologies I discovered the klein form, a "non-orientable surface".<br>
[[File:Klein form.jpg|600px]]
<br>
<br>


    https://en.wikipedia.org/wiki/Abstraction_layer
Klein forms are the basis for the "topologically impossible" klein worms. I first came across these in the first half of the trimester as illustrations in the article "Cybernetic Guerilla Warfare" from the media art newsletter '''Radical Software''':<br>
[[File:Hu-02-ponsot-klein-worms-1971.png]]<br>
<br>
<br>


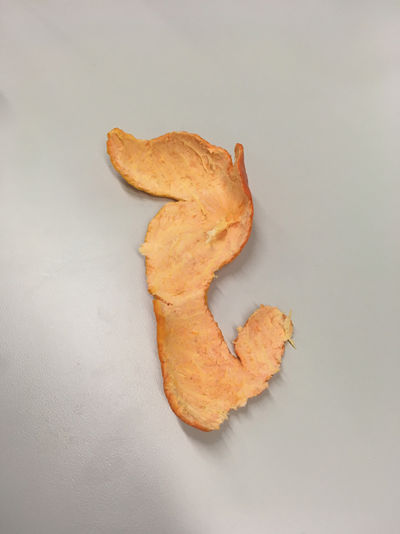
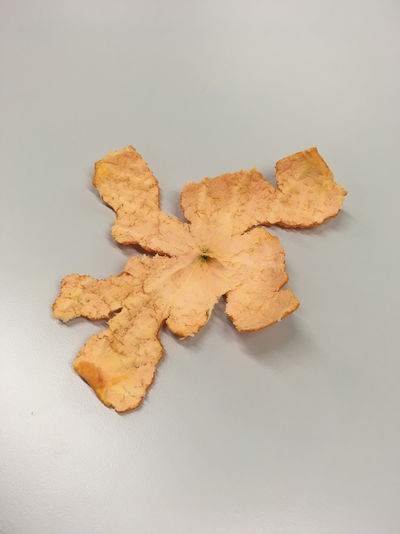
The networked methodology I was working with included shifting between different outcomes and actions. This made me think of also a shift between two-dimensional and three-dimensional forms, and thinking about how these could be "unfolded":<br>
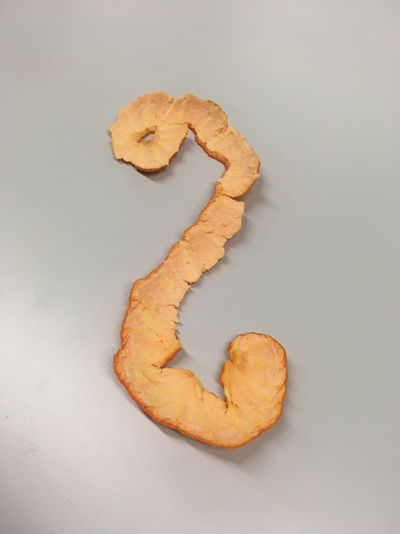
[[File:Mandarin whole.jpg|400px]]
[[File:Mandarin peel 01.jpg|400px]]
[[File:Mandarin peel 02.jpg|400px]]
[[File:Mandarin peel 03.jpg|400px]]
<br>
<br>


Autonomy


    Autonomy is the freedom to make an informed, uncoerced decision. Autonomous organisations, institutions and individuals have independence and the ability to self-govern.
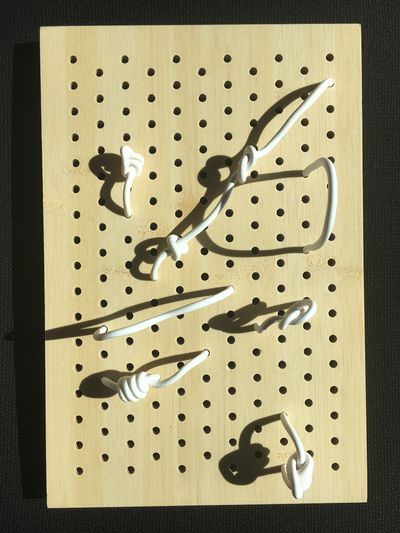
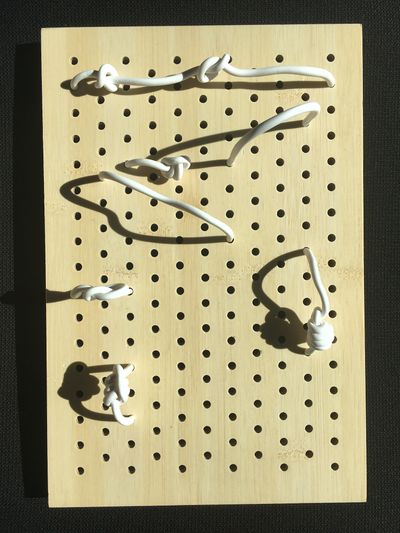
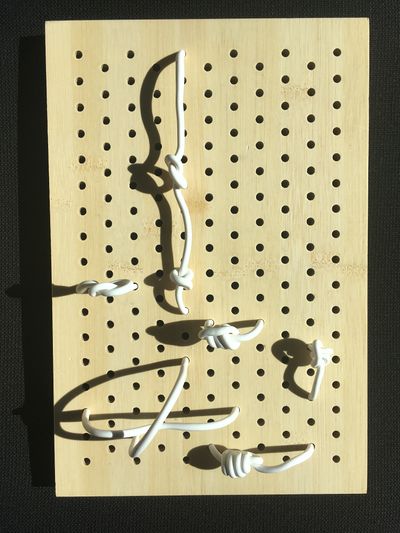
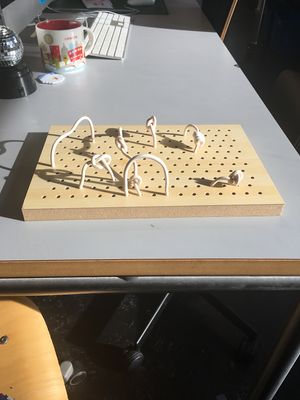
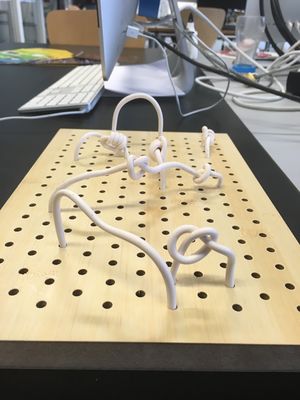
The knotboard I had made in the first half of the trimester proved a useful tool for thinking with my hands. I noticed that as a physical object, it was different from my drawings as it immediately had depth, and form, and as a result was affected by light, particularly shadows:<br>
[[File:knot board 09.jpg|400px]]
[[File:knot board 10.jpg|400px]]
[[File:knot board 11.jpg|400px]]
[[File:knot board 12.jpg|400px]]
<br>
<br>


The AEther
When configured in different ways (especially as a three-dimensional form) the knotboard took on a different presence. I made drawings from this, incorporating light and shadow as well as alternative ways of imagining the three-dimensional space the knotted links occupied:<br>
[[File:Knot board drawing 01 640.jpg]]
[[File:Knot board drawing 02 640.jpg]]
<br>
<br>


    In early modern physics, the luminiferous aether (or ether) was believed to be an invisible space-filling substance or field, that was a transmission medium for electromagnetic or gravitational forces.


Research into knot theory (a field of mathematics which studies the topology of knots) led me to discovering mathematical knots, which are different from the usual idea of a knot. I had previously explored knots as ways to record numbers (a notable reference being Quipu from ancient Andean cultures):<br>
[[File:4 inca quipu knots 640.jpg]]<br>
<br>


Contingency
Mathematical knots are different, in that they are based on the embedding of a circle into three-dimensional Euclidean geometry R3. As such, they resemble closed loops. The first of these is the "unknot":<br>
[[File:Unknot 640.jpg]]<br>
<br>


    A contingency plan; a fall-back, a plan B, what to do if all else fails.


    Contingencies are incidental to something else, dependent on chance, possible, conditional, but usually unnecessary.
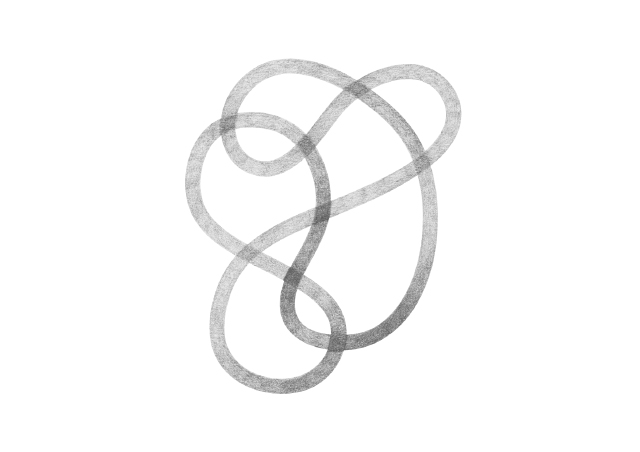
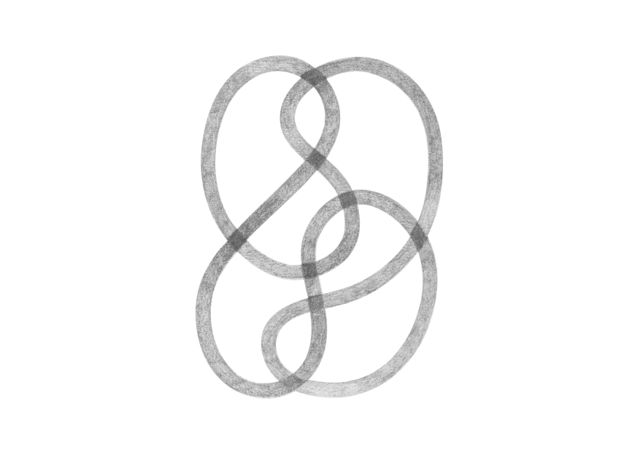
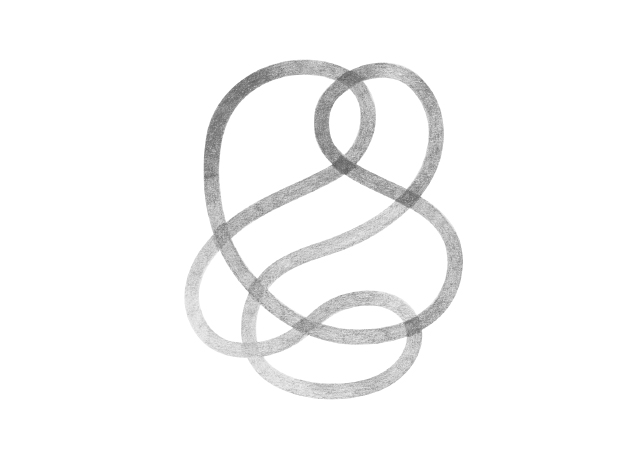
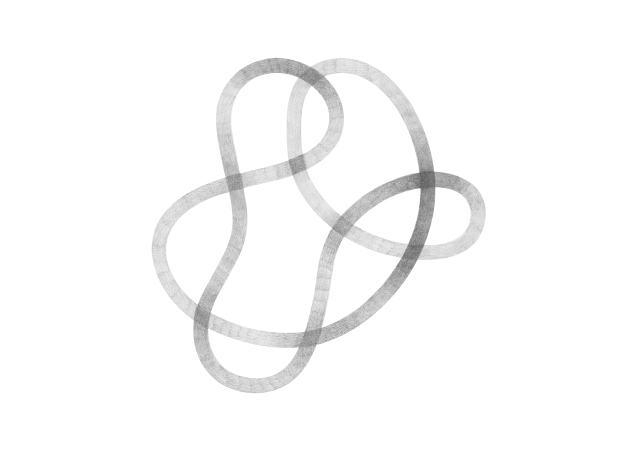
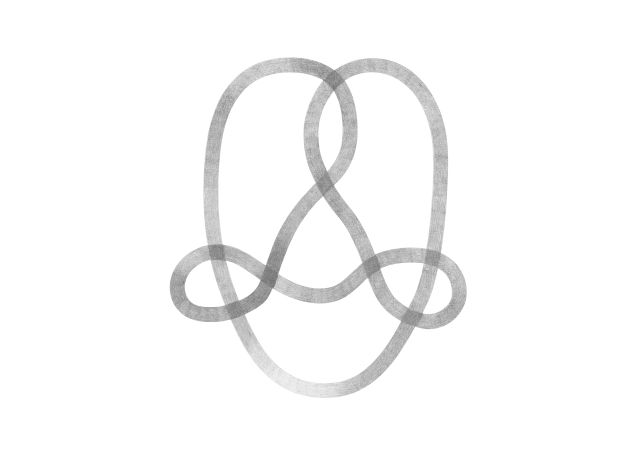
Visualisation is a powerful tool when communicating alternative ways of thinking and "seeing" things. Through visualisation, I found another way of thinking about nodes and links. I made "Knotwork" drawings of knots with eight crossings, each representing a node in our homebrewed network. The crossings could be seen as redistribution points (as in the classic definition of a node), or perhaps an overlapping area of linkage. In respect to thinking about nodes as knots, I found that when the knot is unraveled, the nodes and the links are the same thing.<br>
 
[[File:Knotwork 01 640.jpg|640px]]
 
[[File:Knotwork 02 640.jpg|640px]]
    A contingency is what something allows or doesn’t allow one to do, constrained by its form and use. For example, a pen is often used to write with, but also has the contingency of being used for other purposes, such as scratching one’s back.
[[File:Knotwork 03 640.jpg|640px]]
 
[[File:Knotwork 04 640.jpg|640px]]
 
[[File:Knotwork 05 640.jpg|640px]]
Contrails
[[File:Knotwork 07 640.jpg|640px]]
 
<br>
    Contrails (a portmanteau of "condensation" and "trail") are the line-shaped clouds left behind by the engines of aircraft flying at low altitude. They are commonly composed of water in the form of ice crystals.
 
 
Chemtrail conspiracy theory
 
    The chemtrail conspiracy theory is an erroneous belief that the contrails of aircraft are being used for nefarious purposes, ranging from altering the weather to mind control. As the conspiracy theory goes, Chemtrail (a portmanteau of "chemical" and "contrail") sightings are often reported on the r/chemtrails sub-messageboard of reddit.com, a discussion website which claimes to be "the front page of the internet".


    On this sub-messageboard, under a section titled "Definitions & such" is the short description of a chemtrail as                   
 
    ...a visible trail left in the sky by an aircraft and believed by some to consist of chemical or biological agents released as part of a covert operation.


    Following this is a short text that encourages both believers and skeptics to adopt a tolerant attitude towards each other with a disclaimer:
 
 
    All viewpoints are allowed here, but please be respectful. This is a subreddit, not a court of law. Please don't badger users into providing concrete evidence. Short of flying us all up into the atmosphere with an evidence bag, you probably won't get it.
 
 
Dependencies
 
    Dependencies may be technical, such as software that depends on other software in which to run successfully, or social, as in depending on others in order to achieve a goal.
 
 
Ethernet
 
    Ethernet is a family of computer networking technologies working over WAN (Wide Area Network), LAN (Local Area Network) and MAN (Metropolitan Area Networks). The Internet Protocol is commonly carried out over ethernet, so it has become one of the key technologies that make up the Internet.
 
 
    Ethernet was developed at Xerox PARC (Palo Alto Research Center) between 1973-1974. The idea was first documented in a memo written by Robert Metcalfe, who named it after the luminiferous aether, a substance that was once thought to exist as an "omnipresent, completely-passive medium for the propagation of electromagnetic waves." https://www.youtube.com/watch?v=g5MezxMcRmk
 
 
Graphology
 
    While topology is the study of forms that are preserved under deformations, such as stretching, crumpling or bending (but not tearing or gluing), graphology is the study of diagrams that represent these forms in a 2-dimensional space. Often 3-dimensional topologies can be collapsed into 2-dimension graphology studies.
 
 
GPS
 
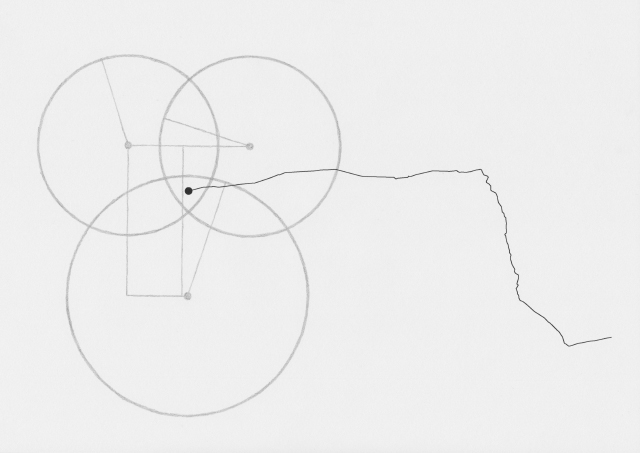
    GPS (Global Positioning Service) is a satellite radionavigation system owned by the United States government, and operated by their air force. The system uses a process of <a href="...html#...>trilateration</a>, whereby at least three satellites are needed to determine position.
 
 
Knots
 
    A knot is an entanglement, an intentional complication in cordage.
 
 
Knotboard
 
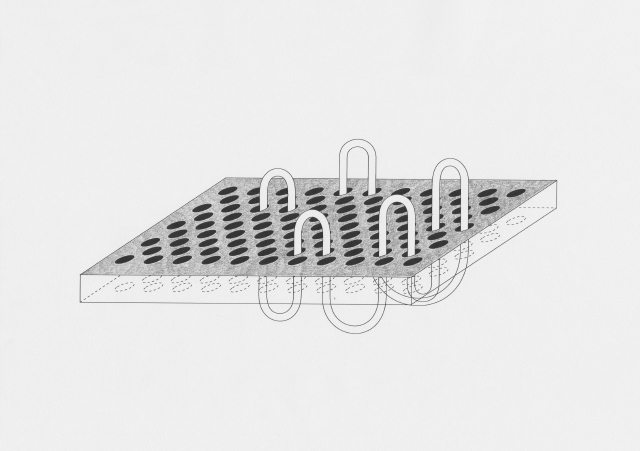
    The knotboard is a piece of wood, pre-drilled with a grid of holes. Accompanying this is an assortment of pre-made polymer clay knotted links. These links can be put into the holes in multiple configurations. By doing this, one can play with the structures of various network topologies. This is a hands-on technique for meditation on networks and a departure point for other forms of representation, including writing, drawing, and walking.
 
 
Knot theory
 
    Knot theory, in mathematics, the study of closed curves in three dimensions, and their possible deformations without one part cutting through another. In mathematical language, a knot is the embedding of a circle in 3-dimensional Euclidean space, R3.
 
 
Knotworks
 
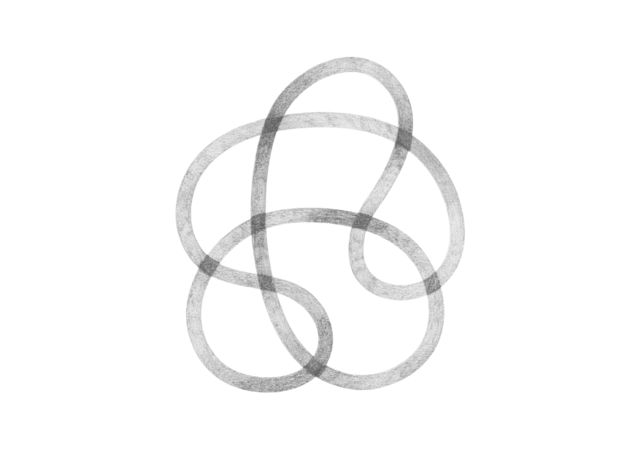
    Knotworks are visualisations of the topology of our small, humble network of home servers. Each Knotwork drawing displays a mathematical knot with eight crossing; each crossing represents a node within the network. The points where the parts of the loop overlap might conceal parts contained, like the internal sections of klein worms. When unravelled, the knot is a continuous loop (an "unknot"), and the links (edges) and the nodes (vertices) are the same.
 
 
Klein bottle
 
    If you like a drink, then a Klein bottle is not a recommended receptacle. It may look vaguely like a bottle, but it doesn't enclose any volume, which means that it can't actually hold any liquid. Whatever you pour "in" will just come back out again as the Klein bottle is an example of a non-orientable surface. It has no "inside" and no "outside", instead, just a side.
 
 
    <img src="img/klein_form.jpg">
 
 
Klein worms
 
    Klein worms are forms based on the klein bottle, drawn by the artist Claude Ponsot. These drawings made their first appearance as illustrations for the article Cybernetic Guerilla Warfare, by Paul Ryan (not the politician) in Radical Software, Vol.1, Issue 3.
 
 
Maps
 
    "The map is a help provided to the imagination through the eyes"
 
    —Henri Abraham Chatelain
 
 
    A map is not the territory it represents, but, if correct, it has a similar structure to the territory, which accounts for its usefulness.
 
    — Alfred Korzybski, Science and Sanity, p.58.
 
 
Map/territory
 
    A map at a 1:1 scale would be of no use to a traveller wishing to simply get from A to B in the easiest possible way. A 1:1 map is the territory, and therefore redundant.
 
 
    Therefore, without some degree of abstraction (beginning with scale), maps would be useless. A map shows not only locations, but also concepts; marking what is public or private property is a way of mapping the world, and determining the difference between travel and trespass.
 
 
Mathematical knots
 
    Mathematical knots, or knots which are studied in the field of knot theory, are based on the embedding of a circle within three-dimensional space. They are different from the usual idea of a knot, that is a string with free ends. Therefore, mathematical knots are (almost) always considered to be closed loops.
 
 
Network of possibilities
 
    I'm making visualisations of things that are not visible in order to better understand them myself. The methodology I'm adopting is one based on a mind-map network, where possible ways to reflect are connected to subsequent actions and outcomes that infinitely loop into each other. In this way, an idea becomes an action (drawing, walking, sculpting, writing), which becomes an outcome (hand-drawing, GPS drawing, clay model, narrative text, explicatory text, and so on), then can become a new idea from which to act again, etcetera etcetera...
 
 
Network topology
 
    Network topology is the arrangement of the elements (links, nodes, etc.) of a communication network. Network topology can be used to define or describe the arrangement of various types of telecommunication networks, including command and control radio networks, industrial fieldbusses, and computer networks.
 
 
    There are two types of network topologies: physical and logical. Physical topology emphasizes the physical layout of the connected devices and nodes, while logical topology focuses on the pattern of data transfer between network nodes.
 
Node
 
    In telecommunications networks, a node (Latin nodus "knot") is either a point at which data is redistributed, or a communication endpoint.
 
Nodocentrism
 
    Nodocentrism is an epistemological bias in which the nodes of a network take primary focus over the connections. In his book "Off the Network: Disrupting the Digital World", Ulises Alí Mejías outlines his theories of nodocentrism as the exclusionary network logic that cannot render anything except nodes, and in opposition, paranodality, the peripheral space, both inside and outside the network, which makes disidentification possible. Together, these concepts prepare the ground for decolonizing the internet by reframing ways of belonging to, and differentiating the self and the collective from, the network.
 
    https://www.upress.umn.edu/book-division/books/off-the-network
 
 
Paranodal
 
    According to Ulises Alí Mejías, the paranodal is "the space between the nodes", and further; "This space surrounding the nodes is not blank". In his essay "Liberation Technology and the Arab Spring: From Utopia to Atopia and Beyond", Mejías describes the paranodal as such; "it is inhabited by multitudes of paranodes that simply do not conform to the organising logic of the network, and cannot be seen through the algorithms of the network. The paranodal is not a utopia—it is not nowhere, but somewhere (beyond the nodes). It is not a heterotopia, since it is not outside the network but within it as well. The paranodal is an atopia, because it constitutes a difference that is everywhere."
 
    Quoted from "Liberation Technology and the Arab Spring: From Utopia to Atopia and Beyond" (Fibreculture Journal, 2012) http://twenty.fibreculturejournal.org/2012/06/20/fcj-147-liberation-technology-and-the-arab-spring-from-utopia-to-atopia-and-beyond/
 
    readings/mejias_liberation_technology.html
 
 
Paranodal activity
 
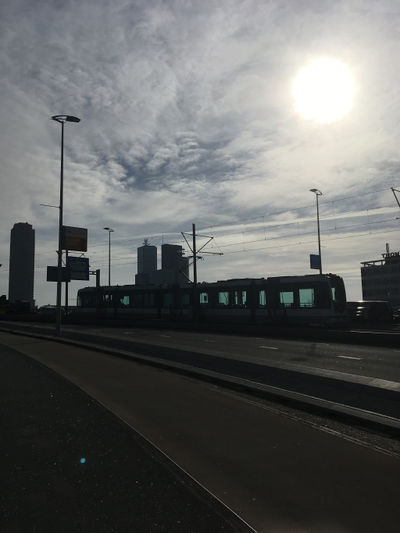
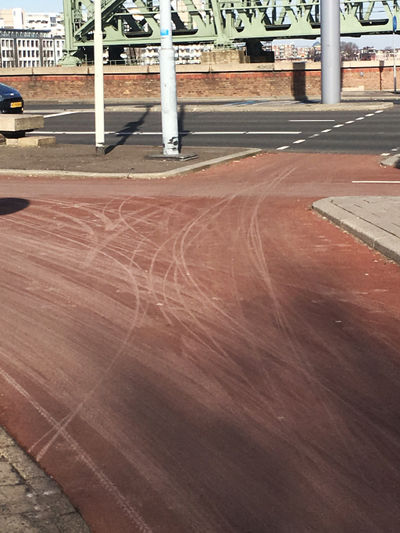
    As I walked from server to server, I began to notice lines. Contrails in the sky, tyre marks on bicycle lanes, overhead tram lines and their corresponding tracks...
 
 
Quipu
 
    Quipu (also spelled khipu) or "talking knots", historically were cords with knots made in them as a way to record numbers, used by various ancient cultures of Andean South America.
 
 
Scale
 
    What does scale mean on a screen?
 
 
Tait conjectures
 
    Peter Guthrie Tait (1837-1901) was a Scottish mathematical physicist, whose investigations in knot theory contributed significantly to the field of topology as a mathematical discipline. His tabulations of knots with ten crossings, which became known as the <em>Tait conjectures</em>, arose out of experiments he conducted with William Thomspon (Lord Kelvin) in <a href="foo.html#1867">1867</a> at the University of Edinburgh.
 
 
Taking a line for a walk
 
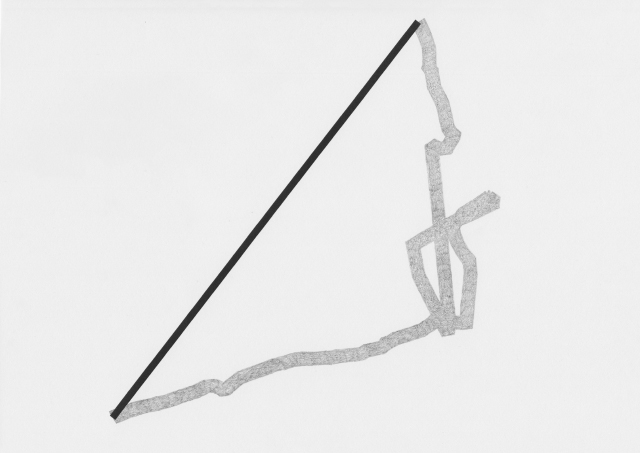
    I'm drawing by making maps, by walking and tracking myself over GPS using an app on my phone. I walk door-to-door between homes containing a homeserver in our network. The app I'm using displays my path as a jagged line, alongside information about the distance, altitude, speed, pace and time elapsed. When I reach my destination I save the walk, export it as a .gpx file to my computer, and then load it into software that allows me to plot the information geospatially. The graphic interface of this software shows dots, which are connected with a series of lines that link them together into a route.
 
 
    This is a visualisation of my movements, abstracted for quick and easy representation. Similarly, ask someone to draw a route from A to B and by default they'll probably sketch a line which bends at angles where you should make a left or a right turn. Even though the most direct route is a completely straight line (as the crow flies), this is hardly useful to the average person. Utility depends on a delicate balance between a certain level of detail, and a certain level of abstraction.
 
 
    Somewhere high above me, satellites trilaterate my position and locate where I am on the globe. They take snapshots and these are intermittently uploaded to a remote server - I don't know where exactly - which serves this data to the software on my phone. When zoomed out, the line appears to be curved, jagged, definitely not straight. However, when zooming in there are many straight lines, and they only bend at anchor points where each snapshot is taken. The line becomes knotted at places, representing social interactions, financial transactions, backtracking, and places where the GPS signal was obscured, or confused by bouncing off buildings.
 
 
    As I walk from homeserver to homeserver, I'm relying on a mental mind-map of Rotterdam, one formed over the past 7 months that I've been here. If I follow my nose, I can usually end up in the general vicinity of where I'm supposed to be. Eventually I need to use an actual map to pinpoint my targeted destination. For the most part I enjoy the increasingly rare occurence of being lost for a moment.
 
 
    If I walk enough routes, this will eventually form a map of Rotterdam, though one reduced down to just simple lines against a blank background. These represent areas that are accessible on foot, most likely the streets and footpaths.
 
 
    The line here meanders slightly, perhaps this is where I crossed a road? I'm still in the habit of walking on the left side of the road, following the direction that traffic moves in Australia. I notice that oncoming pedestrians can't always tell which way I'm going to pass them on the pavement; even on foot we still follow the dominant flow of traffic.
 
 
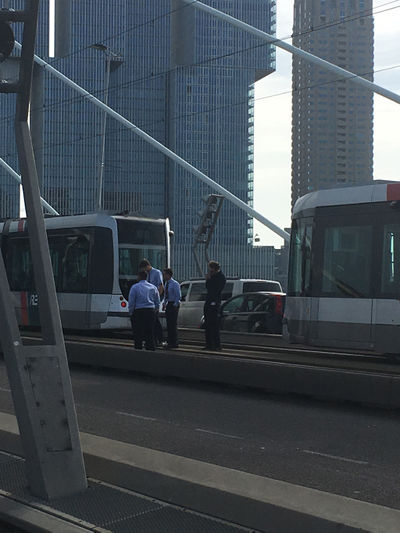
    If you know Rotterdam, perhaps you can identify what the straightest part of this path represents: the Erasmusbrug. It's easy to guess why; the bridge is a high traffic area, and it's not so easy to wander off the path here, or to cross the lanes of traffic going over it. There are also few other ways to cross the Maas River. It could be crossed by boat, and there is also the subterranean Maastunnel further up the river. Or perhaps swim. But any which way one crosses the river, the line represented by GPS tracking software would reveal itself as straight lines between the snapshots taken as the scale increased. On this day the bridge was raised; trams stopped mid-way, and their drivers stood outside, smoking in a cluster. Impatient joggers ran on the spot, the rest of us huddled while we waited for the bridge to lower again.
 
 
Temporary Autonomous Zone (TAZ)
 
    THE CONCEPT OF THE TAZ arises first out of a critique of Revolution, and an appreciation of the Insurrection. The former labels the latter a failure; but for us uprising represents a far more interesting possibility, from the standard of a psychology of liberation, than all the "successful" revolutions of bourgeoisie, communists, fascists, etc.
 
 
    The second generating force behind the TAZ springs from the historical development I call "the closure of the map." The last bit of Earth unclaimed by any nation-state was eaten up in 1899. Ours is the first century without terra incognita, without a frontier. Nationality is the highest principle of world governance--not one speck of rock in the South Seas can be left open, not one remote valley, not even the Moon and planets. This is the apotheosis of "territorial gangsterism." Not one square inch of Earth goes unpoliced or untaxed...in theory.
 
    The "map" is a political abstract grid, a gigantic con enforced by the carrot/stick conditioning of the "Expert" State, until for most of us the map becomes the territory--no longer "Turtle Island," but "the USA." And yet because the map is an abstraction it cannot cover Earth with 1:1 accuracy. Within the fractal complexities of actual geography the map can see only dimensional grids. Hidden enfolded immensities escape the measuring rod. The map is not accurate; the map cannot be accurate.
 
    So--Revolution is closed, but insurgency is open. For the time being we concentrate our force on temporary "power surges," avoiding all entanglements with "permanent solutions."
 
 
    And--the map is closed, but the autonomous zone is open. Metaphorically it unfolds within the fractal dimensions invisible to the cartography of Control. And here we should introduce the concept of psychotopology (and -topography) as an alternative "science" to that of the State's surveying and mapmaking and "psychic imperialism." Only psychotopography can draw 1:1 maps of reality because only the human mind provides sufficient complexity to model the real. But a 1:1 map cannot "control" its territory because it is virtually identical with its territory. It can only be used to suggest, in a sense gesture towards, certain features. We are looking for "spaces" (geographic, social, cultural, imaginal) with potential to flower as autonomous zones--and we are looking for times in which these spaces are relatively open, either through neglect on the part of the State or because they have somehow escaped notice by the mapmakers, or for whatever reason. Psychotopology is the art of dowsing for potential TAZs.
 
    — Hakim Bey, excerpt from 'The Psychotopology of Everyday Life', T.A.Z, The Temporary Autonomous Zone, 1991.
 
    readings/the_psychotopology_of_everyday_life.html
 
 
Terra Nullus
 
The Seven Bridges of Königsberg
 
    The Seven Bridges of Königsberg is a historical mathematical problem which laid the ground for graph theory, and prefigured topology. Königsberg, in former Prussia (now Kaliningrad, Russia), set on both sides of the Pregel River, included two large islands - Kneiphof and Lomse - which were connected to the mainland by a series of seven bridges. The problem was to devise a walk through the city crossing each of those bridges once and only once.
 
 
    The negative solution came from Swiss mathematician and physicist Leonhard Euler, who pointed out that the choice of route inside each land mass was irrelevant; only the sequence of crossings mattered. Euler created a diagram in which each land mass was represented by a "vertex" or node, and each bridge became an "edge", or link between them. This allowed him to consider the problem in abstract terms, in the mathematical structure of a graph.
 
 
    As only the connection information is relevant, the shape of the pictorial representations can be distorted in any way without changing the graph. For example, it does not matter if the links drawn are stright or curved, or whether a node is to the left or right of another.
 
 
    Euler observed that, except at the beginning and end of the walk, if one enters a land mass by a bridge, one must leave a land mass by a bridge. In other words, at any time during the walk, the number of times one enters a non-terminal vertex equals the number of times one leaves it, meaning that the total number of bridges touching that land mass must be even, as half the crossings will be towards a land mass, and the other half away from it. However, all four of the land masses in the problem are touched by an odd number of bridges (one is touched by 5, the other three by 3). Since only two land masses can act as the beginning or end, it is impossible to cross each bridge only once during a walk.
 
 
Topology
 
    Topology is a non-metric elastic geometry. It is concerned with transformations of shapes and properties such as nearness, inside and outside. (from Cybernetic Guerilla Warfare)
 
    readings/cybernetic_guerilla_warfare.html
 
 
Unknot
 
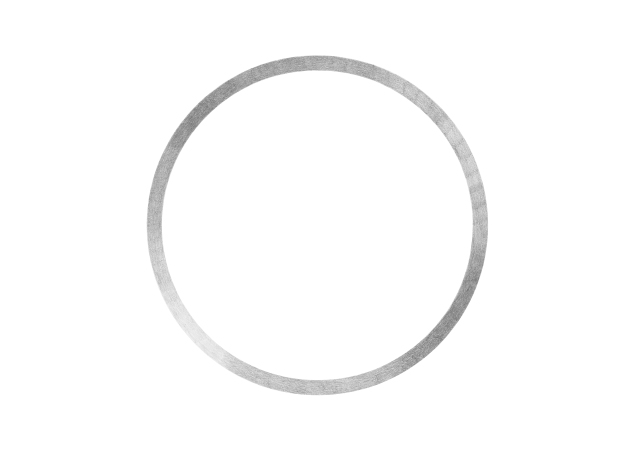
    The unknot, also known as the trivial knot, or torus, comes from the mathematical field of knot theory. Intuitively, the unknot is a closed loop of rope without a knot in it. The unknot is described by knot theorists as any form that can be deformed to the embedding of the geometrically round circle.
 
 
Unraveling knots
 
    The map I've been making by tracking myself over GPS does not display scale, or landmarks, or street names. It doesn't show which way is north, south, east or west. I use geographic information system software that allows me to accurately position all the .gpx files I upload from my GPS tracker app on my phone.
 
 
    In a vector graphics editor I begin to simplify the line, sliding a scale that removes anchor points and unravels the knot into a completely straight line. As I do this, I notice smaller knots that were not so visible at the scale I saw them at originally.


</code>
 
https://pad.xpub.nl/p/networked_research<br>
 
As I wanted a fairly horizontal structure to my research, I decided to base the content for each page of my website on a walk.
 
==Drawing visualisations==
Drawing (by hand and using vectors) became a large part of the outcomes I produced as part of my research. The drawings often shifted between "hand-drawn" and "computer-drawn", for example, I would use a .svg file made from one of my GPS walks in a vector graphics program, then print it and hand-draw with pencil over the top.<br>
 
When I imported the lines I made by GPS walking into .svg format, I tried to unravel some of the knots I made while walking, and then drew several snapshots of this process.

Latest revision as of 16:45, 8 April 2019


First half: Mapping network topologies

paul baran diagrams

We started with a reading of a text on centralised, decentralised, and distributed networks that included a diagram made by Paul Baran for the RAND corporation. This diagram displays classic ways to visualise these networks.

On Distributed Networks, 1964, Paul Baran, diagram for RAND research memoranda 3420

dependency mapping task

As part of the Infrastuctour, when we set up our homeservers, I worked with Artemis to create a visualisation of the dependencies involved setting them up.

19 01 20 dependencies.jpg

physical map in XPUB studio

I made a map of the location of homeservers and routers, including the other (non-XPUB) network users as well as situations where it was not possible for XPUB students to connect their server to their home router, and so had to depend on others. Manetta introduced me to Inca Quipu, a way that the Inca recorded numbers by tying knots in strings.

Paint3.png Quipu 4 incas.gif

I connected a piece of string I'd tied knots in to represent my external IP address for my home server, as a way to visualise the idea of connecting and also the route that a client follows when connecting to my website, which is in reverse from the way I would display my IP.

Map 7914.JPG Map 7915.JPG Map 7916.JPG Map 7918.JPG

collection of texts

I began collecting relevant texts to my research and creating html pages to store them on my website. This has been a useful way to develop my web design knowledge and skills as well as provide theoretical basis for the research I'm undertaking into network topologies.

Tung-Hui Hu: Truckstops on the Information Superhighway
http://b-e-e-t.r-o-o-t.net/pages/truckstops_on_the_information_superhighway.html

Paul Rand: Cybernetic Guerilla Warfare (Radical Software 1.3)
http://b-e-e-t.r-o-o-t.net/pages/cybernetic_guerilla_warfare.html

R. Buckminster Fuller: Software (Radical Software 1.1)
http://b-e-e-t.r-o-o-t.net/pages/buckminster_fuller_software.html

These texts introduced me to alternative models for mapping topologies such as "klein worms", referred to in both Hui (2015) and Rand's (1970) texts. Klien worms are based on the klein bottle, which falls into the category of "topologically impossible" objects (such as moebius strips etc.).
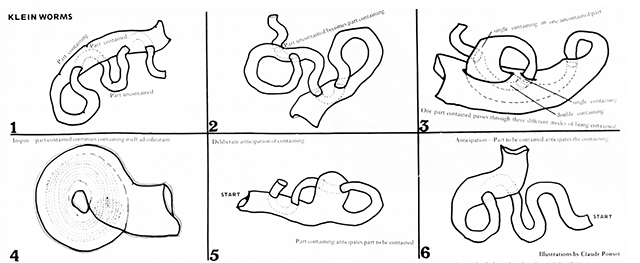
Fig. 2. Klein Worms, 1971, Claude Ponsot, illustration for Paul Ryan, “Cybernetic Guerilla Warfare,” in Radical Software 1:3

Paranodal activity

The concept of paranode (as suggested in Constant's Feminist Server Manifesto, and further explored by Zach Blas) was intriguing, and I resolved to keep this in mind when mapping network topologies. I see the paranode as both a disruptive concept (the thing that isn't there?), also not related to physical devices (established as nodes, but instead on social and conceptual relations between people and the world). I took initial references from the SI concept of the derive as a way to rethink autonomy in public space.

On further reading I found this article:
http://www.christydena.com/2007/08/new-network-theory-the-tyranny-of-nodes/

The author defines the paranodal in this way: the space between nodes; the space that is not dead, but very much alive.

The author also uses Ranciere's terminology, saying: the paranodal is "the part of those who have no part", where we experience what it is to be outside of the network while still being related to it.

maps and autonomy

I began recording some of my thoughts around the concept of contingent autonomy and how it relates to mapping. These refer to the map/territory problem, which sees a 1:1 map as redundant (and therefore useless) and also Hakim Bey's Temporary Autonomous Zone concept (introduced to me by Tancre), where the 1:1 map is the only possible way for someone to have autonomy.
https://pad.xpub.nl/p/map_thoughts

topology and graphology

Early references explored knot theory, a study in mathematics which takes knots as topological forms. I found these interesting as alternative models of topology to the one presented by Baran; also as Roel pointed out, the etymology of the word "node" comes from the word for "knot".

Tabela de nós matemáticos 01, crop.jpg Tait-On-knots-03.jpg


Michael introduced me to Jacqueline de Jong's Situationist Times, which I found interesting (particularly Issue 3: Topology).


My research led me to discover the famous Seven Bridges of Königsberg (now Kaliningrad, Russia) problem, which prefigured topology and laid foundations for graphology (a graphic mapping of topologies). The problem asked how to devise a walk across these bridges, crossing each one only once. This was answered as impossible by Euler, who also demonstrated how the physical landscape could easily be abstracted into a graph.
Seven Bridges of Konigsberg

Seven bridges koningsberg.png

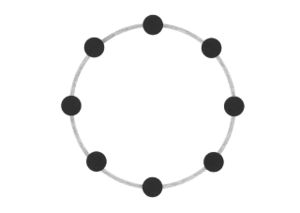
I also began to draw examples of network topologies based on the form of knots that I had explored with making of the physical map. I was interested in how the knots could represent physical, linear movements of data, but when in silhouette, resembled representations of distributed networks.

Dot knots 01.jpg 19 02 05 big dots knots.jpg Router wifi 01.jpg Circular signal.jpg

modularity

I began to make small sculptural models of theoretical network topologies out of polymer clay, which resembled mathematical knots.
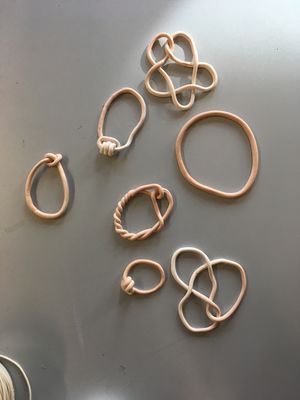
Knot model 01.JPG

These developed into a model which incorporated a wooden board with regular holes drilled in it, kind of a static interface that these loops and knots could be inserted into, in a similar way to a modular synthesiser. This was partly inspired by a session in which artist Aditya Mandayam demonstrated use of the Plumbutter2, a modular synthesiser that comes with a manifesto and also represents a "map of Baltimore".

Knot board 02.JPG Knot board 05.JPG Knot board 01.JPG

Second half: Visualising network topologies

network of possibilities
Network of possibilities hi res.jpg

I began the second half of the trimester by determining a networked methodology for producing outcomes. The aim was to develop a heuristic; a technique which would help me understand networks better through a looped system of ideas, actions and outcomes.


gps walking
GPS walking.jpg

One of the actions I included in my network of possibilities was to begin walking between different points in our network (our homeservers, and also the PZI building where we gathered to have classes and work on Special Issue 08).
Trails.png

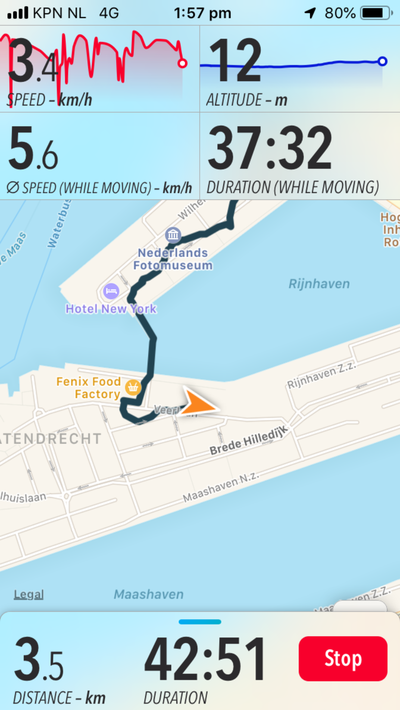
I used a hiking app called "Trails", which would record my walk over GPS, from which I could export the .gpx file generated after walking, and then load it into a program for geospatial information called QGIS. An interesting feature of this software is in how it represents the line created by walking - you can upload it as trackpoints (snapshots of your location determined by satellite trilateration), and also as straight lines between the trackpoints. I started to realise how abstraction was a large part of mapping, which reminded me of the map/territory problem.

I began to make drawings, which, by being devoid of text that would explain them, could act as illustrations of how this map was being made:
Gps trilateration 640.jpg


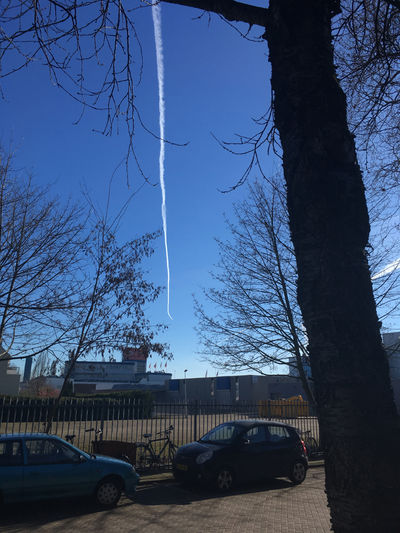
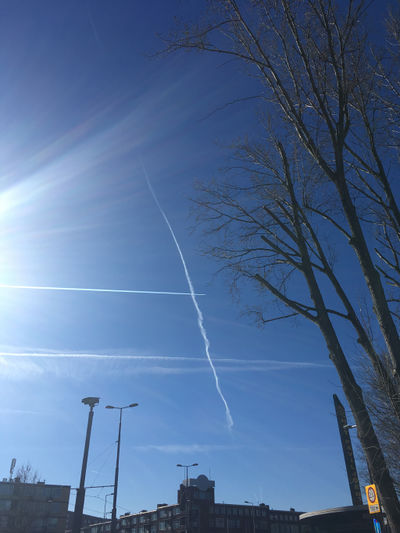
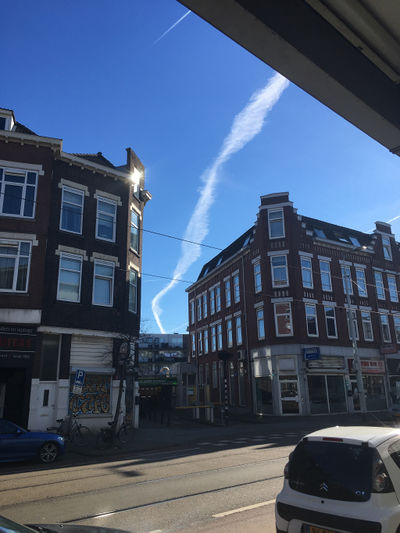
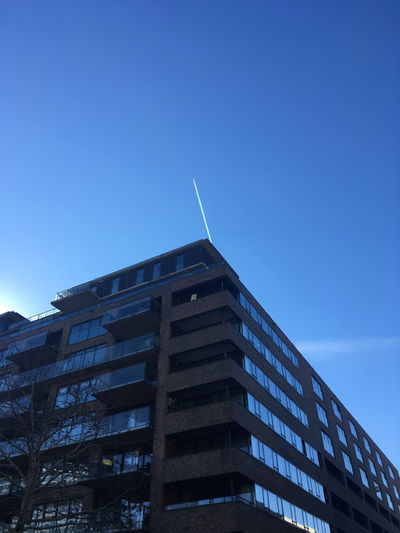
During each walk I would take photos and write notes on thoughts that came up. I began noticing other networks around me.

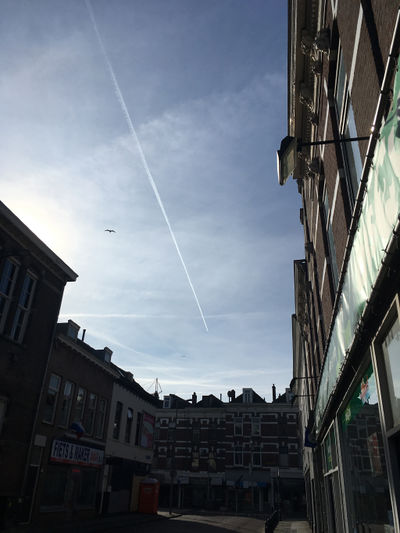
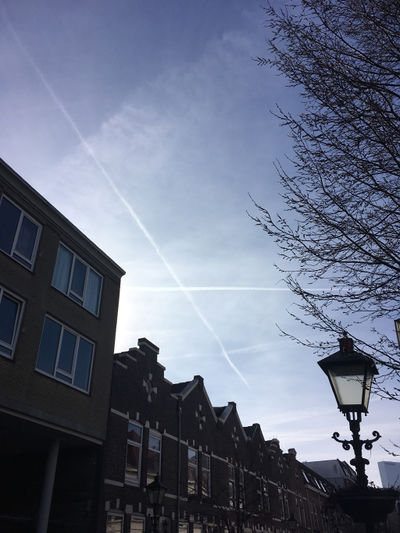
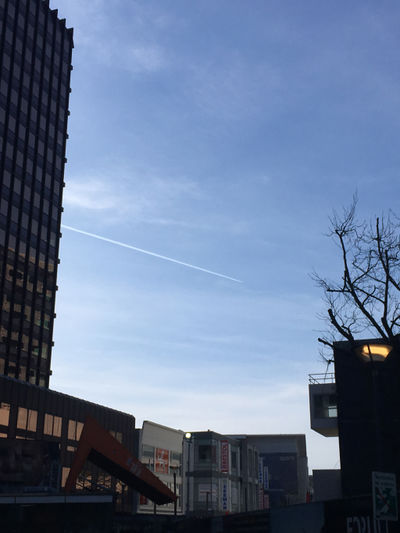
Flight paths that produced contrails (or chemtrails):
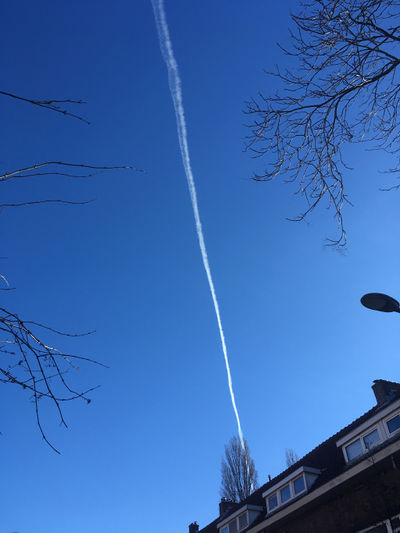
Contrail 2 2.jpg Contrail 2 3.jpg Contrail 2 4.jpg Contrail 2 5.jpg
Contrail 2 7.jpg Contrail 1 1.jpg Contrail 1 3.jpg Contrail 1 5.jpg

Public transport networks:
Erasmusbrug tram.jpg

Bicycle networks:

Bicycle path.jpg


Social networks:
Erasmusbrug smoking.jpg

Each walk became an act of drawing (using GPS) and also a meditation.


networked research

I also began to write down my thoughts on various topics that came up.
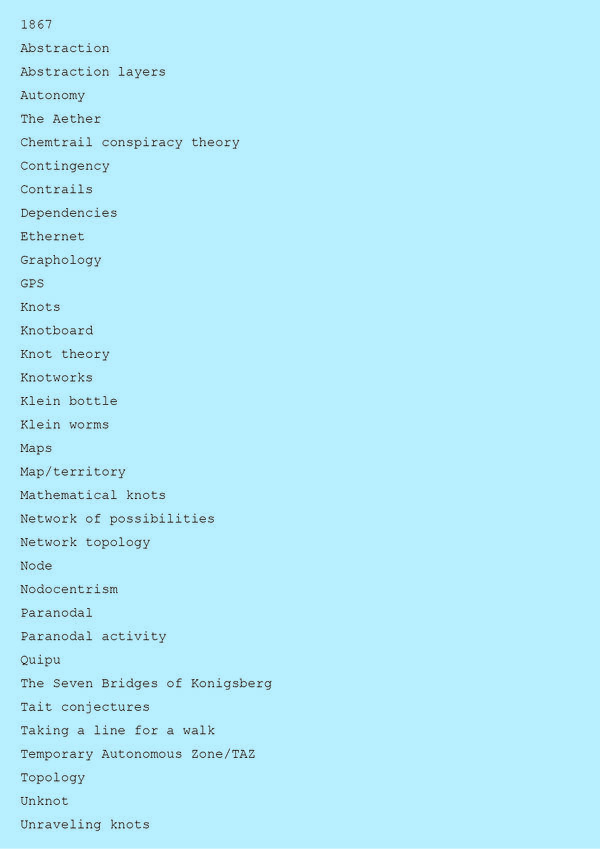
Strips 02.jpg

https://pad.xpub.nl/p/networked_research

As I wanted a fairly horizontal structure to my research, I decided to base the content for each page of my website on a walk.

drawing visualisations

Drawing (by hand and using vectors) became a large part of the outcomes I produced as part of my research. The drawings often shifted between "hand-drawn" and "computer-drawn", for example, I would use a .svg file made from one of my GPS walks in a vector graphics program, then print it and hand-draw with pencil over the top.

Abstraction became a key interest, and I started to think more about how these different ways of visualising all employed some level of abstraction in order to communicate. This brought me back to the typical idea of displaying network topology, as nodes and straight lines:
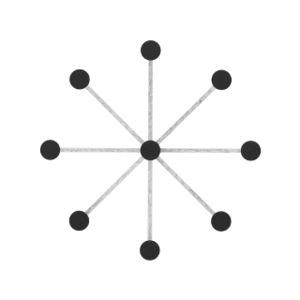
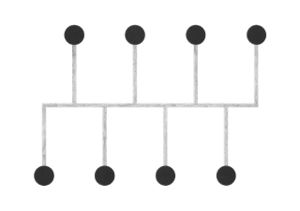
Star topology wht 640.jpg Bus wht topology 640.jpg Ring wht topology 640.jpg Mesh wht topology 640.jpg

The drawings I made while GPS walking employed straight lines between trackpoints. However, this was just an abstraction - there are no straight lines in reality. In fact, the more accurately I would be able to map the network, the less useful it would be as a readily comprehensible visualisation. I also noticed that at points the GPS signal had become confused or obscured - this happened when I went into buildings (such as a cafe to buy a coffee) or when the signal might have been obscured by tall buildings around me. This produced knots, which I saw as analogous to nodes.
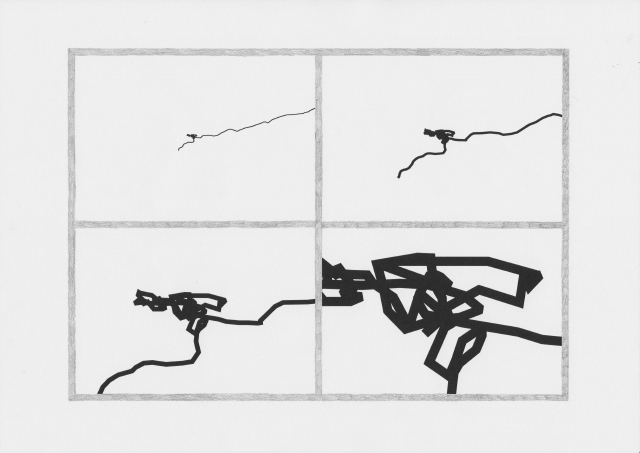
Knot scale times four 640.jpg

When I imported the lines I made by GPS walking into .svg format, I experimented with unraveling some of these knots, and then drew this process.
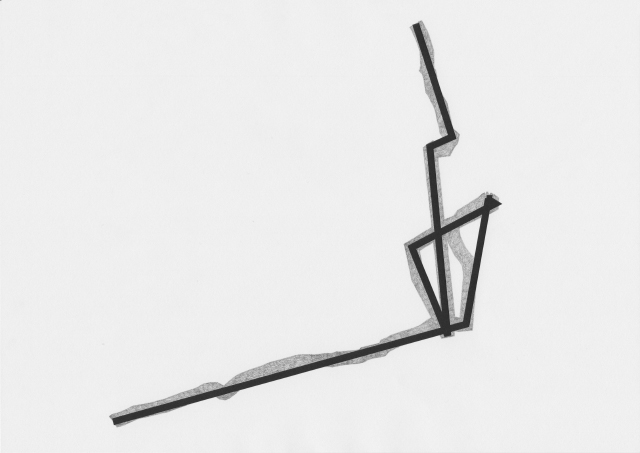
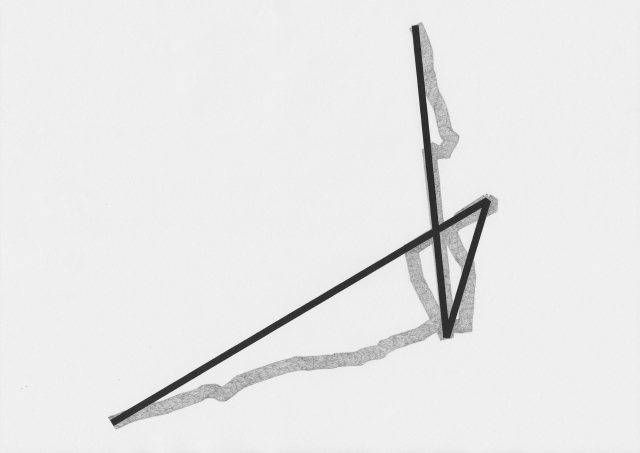
Unravelled knot 03 640.jpg Unravelled knot 02 640.jpg Unravelled knot 01 640.jpg


knotboard, knots, knotworks

Early on in my research into network topologies I discovered the klein form, a "non-orientable surface".
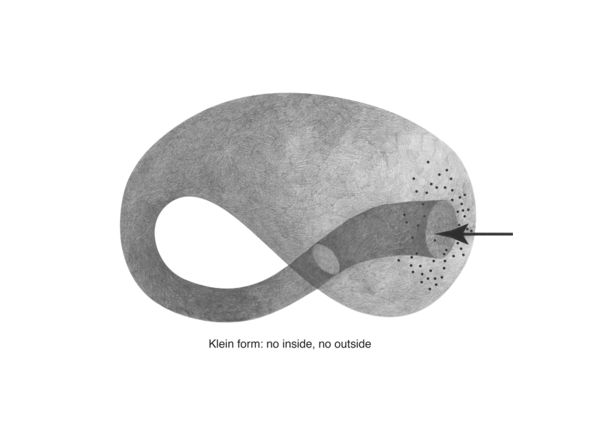
Klein form.jpg

Klein forms are the basis for the "topologically impossible" klein worms. I first came across these in the first half of the trimester as illustrations in the article "Cybernetic Guerilla Warfare" from the media art newsletter Radical Software:
Hu-02-ponsot-klein-worms-1971.png


The networked methodology I was working with included shifting between different outcomes and actions. This made me think of also a shift between two-dimensional and three-dimensional forms, and thinking about how these could be "unfolded":
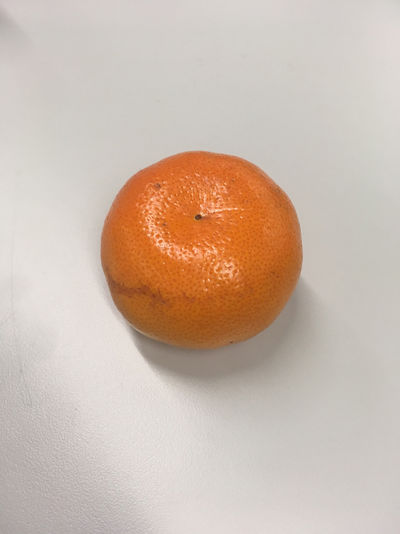
Mandarin whole.jpg Mandarin peel 01.jpg Mandarin peel 02.jpg Mandarin peel 03.jpg


The knotboard I had made in the first half of the trimester proved a useful tool for thinking with my hands. I noticed that as a physical object, it was different from my drawings as it immediately had depth, and form, and as a result was affected by light, particularly shadows:
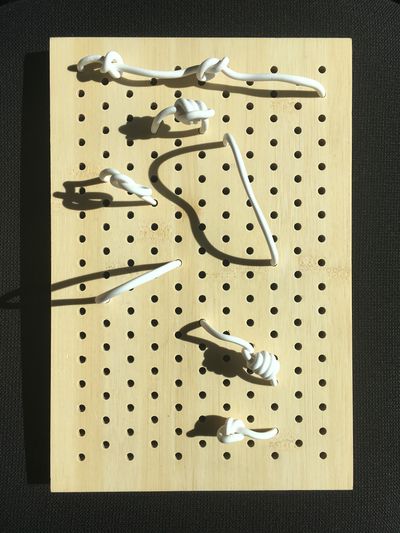
Knot board 09.jpg Knot board 10.jpg Knot board 11.jpg Knot board 12.jpg


When configured in different ways (especially as a three-dimensional form) the knotboard took on a different presence. I made drawings from this, incorporating light and shadow as well as alternative ways of imagining the three-dimensional space the knotted links occupied:
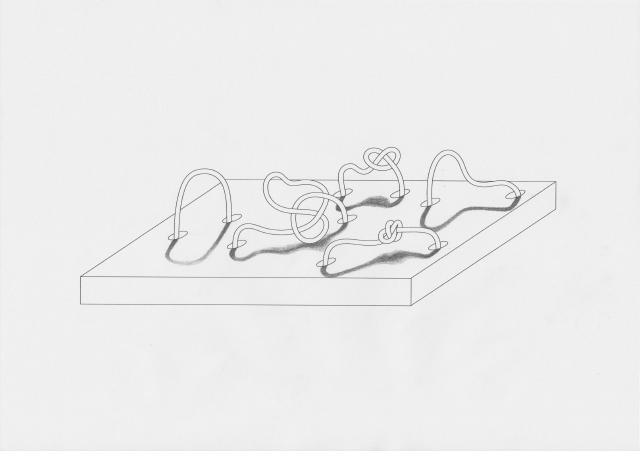
Knot board drawing 01 640.jpg Knot board drawing 02 640.jpg


Research into knot theory (a field of mathematics which studies the topology of knots) led me to discovering mathematical knots, which are different from the usual idea of a knot. I had previously explored knots as ways to record numbers (a notable reference being Quipu from ancient Andean cultures):
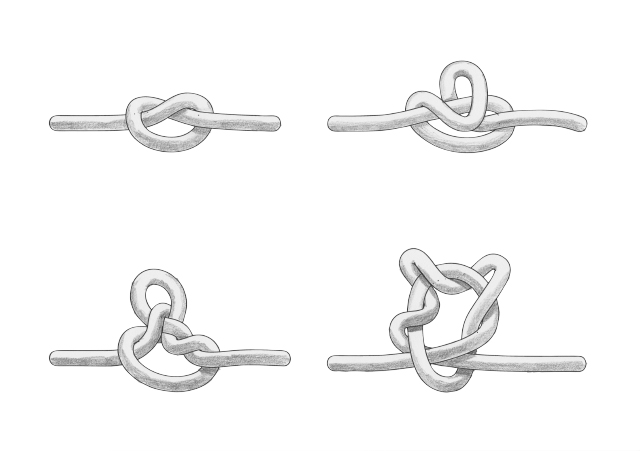
4 inca quipu knots 640.jpg

Mathematical knots are different, in that they are based on the embedding of a circle into three-dimensional Euclidean geometry R3. As such, they resemble closed loops. The first of these is the "unknot":
Unknot 640.jpg


Visualisation is a powerful tool when communicating alternative ways of thinking and "seeing" things. Through visualisation, I found another way of thinking about nodes and links. I made "Knotwork" drawings of knots with eight crossings, each representing a node in our homebrewed network. The crossings could be seen as redistribution points (as in the classic definition of a node), or perhaps an overlapping area of linkage. In respect to thinking about nodes as knots, I found that when the knot is unraveled, the nodes and the links are the same thing.
Knotwork 01 640.jpg Knotwork 02 640.jpg Knotwork 03 640.jpg Knotwork 04 640.jpg Knotwork 05 640.jpg Knotwork 07 640.jpg