Scripts for collective performance
- 10:00-11:00 diving into graphviz
- 11:00-13:00 scripts making
- 13:00-14:00 lunch break
- 14:00-16:00 scripts making
- 16:00-16:30 print your scripts
- 16:30-17:00 performing each others scripts!
Scripts for collective performance
Have you been involved in collective practices?
How do you understand the difference between collaborative ↔ collective work?
What forms of collectivity in everyday life come to mind?
Which communities of practice[Susan Leigh Star] are you part of?
which collective
- think of a collective situation
- focus on one specific action that is part of this situation
- describe this action in 3 steps
- turn this into a diagram with graphviz
loopy situations
- think of a collective situation that involves repetition
- describe the repetition in 5 steps, and make sure step 5 connects back to step 1
- turn this into a diagram with graphviz
if or else
- think of an everyday situation that involves making choices
- describe one of such choice making moment in 3 steps:
- describe situation
- describe the 2 options that are there
- describe what happens when choosing option 1, and what happens when choosing option 2
- turn this into a diagram with graphviz
Graphviz
Graphviz is open source graph visualization software. Graph visualization is a way of representing structural information as diagrams of abstract graphs and networks. It has important applications in networking, bioinformatics, software engineering, database and web design, machine learning, and in visual interfaces for other technical domains.
Starting in the middle of
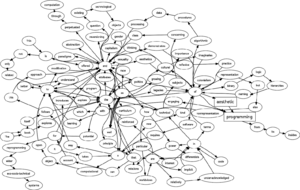
- cover graph of the Aesthetic Programming book: https://aesthetic-programming.net/ (OSP, Winnie Soon, Geoff Cox)
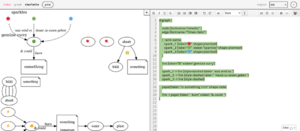
- OSP workshop at Karlsruhe with etherdot: http://osp.kitchen/workshop/karlsruhe/ (June 2023)
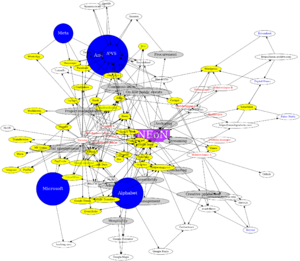
- NeON's infrastructure observations, in Counter Cloud Action Plan by TITiPI for NeON https://titipi.org/wiki/index.php/Counter_Cloud_Action_Plan#Observations
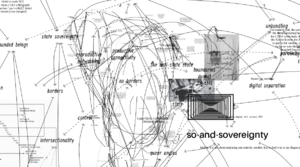
- So-and-sovereignty diagrams (Martino Morandi and Femke Snelting/TITiPI) + https://gitlab.constantvzw.org/titipi/Tardigraph, source: https://gtr.ukri.org/projects?ref=AH%2FX006379%2F1
As part of Energy Giveaway at the Humuspunk Library, AIA, Zurich, interdependent artist/researcher Martino Morandi and Femke Snelting developped three diagrams. Thinking with nematodes and teletypes, with imbricated servers and institutional burrows, this shape-shifting diagram both traces and re-plots an ongoing conversation about modes of interdependence under the regime of The Cloud. The diagrams zoomed in on geometries and vocabularies that once seemed useful for limiting damage, creating solidarity and re-organizing collective resources, showing how they have been turned inside-out and are in need of a collective re-articulation of forms of togetherness.
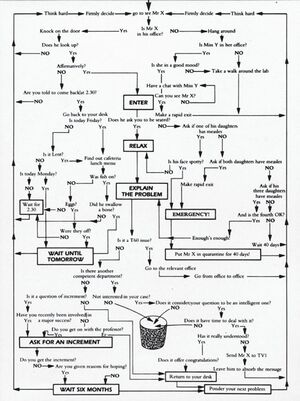
- The Art of Asking Your Boss, by George Perec; described in Mainframe Experimentalism, by Hannah Higgins Chapter 2 + a radio version
what Perec discovered as he wrote out the “simultaneous” flowchart protocol was that time reinserts itself by necessity in any narrative, even when obstinately restricted to the present tense: the employee seeking a raise is a little older at each approach to his head of department whenever the arrows and choices take him back to the top of his chart. Because of this, the recursion cannot be infinite, because if algorithms exist without time, men do not, and must die. – Mainframe Experimentalism, by Hannah Higgins
- graphviz gallery https://graphviz.org/gallery/
- gradient examples https://graphviz.org/Gallery/gradient/
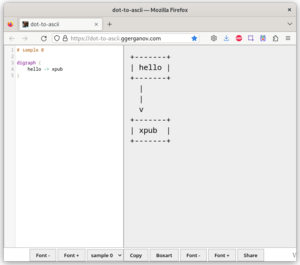
- dot-to-ascii web editor: https://dot-to-ascii.ggerganov.com/ + source code
- PythonGraphviz
Use graphviz
For example with dot:
$ dot hello.dot -Tpng -O
You can save your graphviz code to a .dot file. The command above reads this file hello.dot and renders the graph into a PNG image, which is saved with the same filename, but with the PNG extension: hello.dot.png.
Check the manual to find more options: $ man dot
Nodes and edges
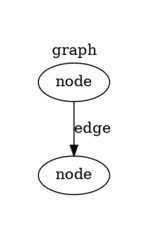
Graphviz works with the dot language, and works with graphs, nodes and edges.
You can change the type, color and behavior of these with attributes and shapes:
This page lists a range of examples: https://renenyffenegger.ch/notes/tools/Graphviz/examples/index
Layout engines
Graphviz comes with a set of different built-in layout engines and each of these render the graph differently:
- dot: hierarchical
- neato: spring
- circo: circular
- twopi: radial
- fdp: force-directed placement
Each of these are installed when you install graphviz. To use them, you change use the name of the layout engine as command in the CLI:
$ dot
$ neato
$ circo
$ twopi
$ fdp
You can check them all here: https://graphviz.org/docs/layouts/
Output formats
Graphviz uses a range of output formats, such as:
- svg
- png
- jpeg
To change the output format, you change the -Tsvg part of your command:
-Tsvg
-Tpng
-Tjpg
-Tpdf
There is a list here: https://graphviz.org/docs/outputs/
What is nice when you export to svg is that you can use graphviz as an initial step in your workflow, and continue working on your diagram in other vector editing software, such as Inkscape or others. And! when saving as svg, your diagram stays a vector drawing, which also means you scale it, copy/paste it into a web page, and... pen plot it!
And about png: this is a good image file format if you want to render your diagram as a static image file, as it good for detailed line drawings and typography, and it support transparency.
dot language
https://graphviz.org/doc/info/lang.html
Some examples.
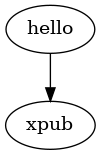
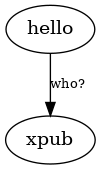
You create edges with an "arrow": ->:
digraph {
  hello -> xpub
}
You can label an edge:
hello -> xpub [label="who?"]
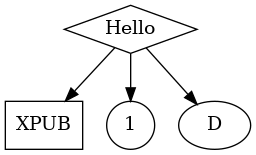
You can use id's to assign attributes to a node:
  A [label="Hello" shape=diamond]
  B [label="XPUB" shape=box]
  C [label="1" shape=circle]

  A -> B
  A -> C
  A -> D
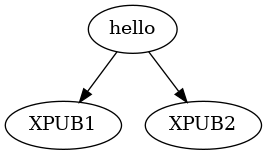
You can use subgraphs to create multiple edges in one go:
hello -> {XPUB1 XPUB2}
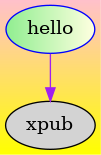
And you can use attributes to render your diagram in a specific way/color/font/size/...:
https://graphviz.org/docs/attr-types/style/
digraph {

  /* set graph attributes here */
  bgcolor="yellow:pink"
  gradientangle=90

  /* set node attributes here */
  A [label="hello" style=filled color=blue fillcolor="lightgreen:lightyellow" gradientangle=0]
  B [label="xpub" style=filled]

  /* set edge attributes here */
  A -> B [color=purple]

}
You can use a subset of HTML-like elements:
https://graphviz.org/doc/info/shapes.html#html
 A [label=<so <b>bold</b>>]
 B [label=<so <i>italic</i>>]
 C [label=<so <s>deleted</s>>]
Play with the node shapes:
https://graphviz.org/doc/info/shapes.html
 diamond [fillcolor=yellow style="rounded,filled" shape=diamond]
 house [shape=house style=filled fillcolor=pink]
Let shapes grow with linebreaks or position labels with spaces:
 biggercircle [label="\nthis is how \nyou can make \nit bigger\n"]
 align [label="        now there is more space on the left"]
Use colors:
https://graphviz.org/doc/info/colors.html
https://graphviz.org/docs/attr-types/style/
 A [label="hello" color=pink fontcolor=blue style=filled]
 B [label="XPUB" color="darkseagreen1:deepskyblue" style=filled fontcolor=red]

 A -> B [color=purple]
Use different fonts:
https://www.graphviz.org/docs/attrs/fontname/
https://graphviz.org/faq/font/ "why fonts are a hard problem"
XPUB [fontname="Crickx"]
but! this font needs to be listed in your fc-list: $ fc-list
Choose how and if edges are represented:
https://graphviz.org/docs/attrs/splines/
 splines=none
 splines=line
 splines=curved
 splines=polyline
 splines=ortho
Choose where an edge connects:
https://graphviz.org/docs/attr-types/portPos/
 hello:n -> xpub:s
 hello:s -> you:nw
Increase the size of your image:
dpi=300

