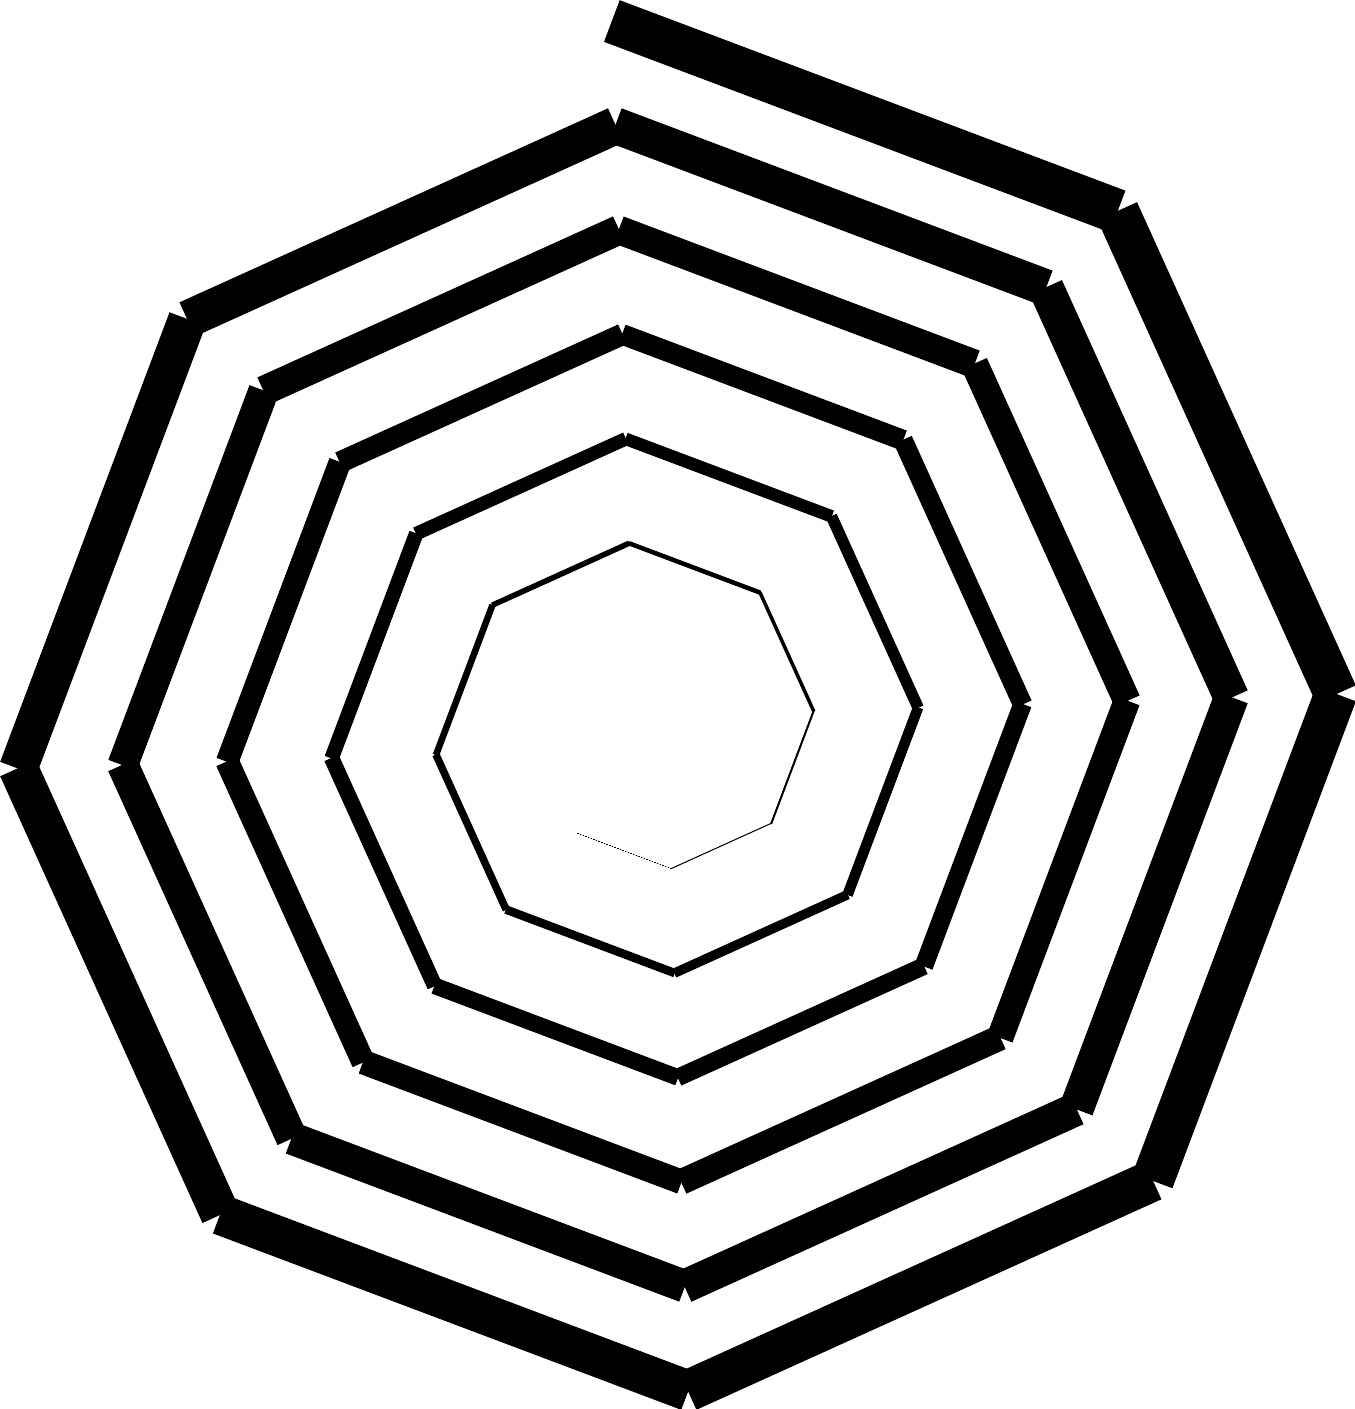
Turtle Graphics
Turtle graphics refers to a technique of allowing graphics to be drawn, typically on a computer screen, by controlling a virtual "turtle" with simple commands like forward and turn. Turtle graphics were first described using the programming language LOGO, and were created by Seymour Papert as part of constructivist approach to teaching kids geometry by creating simulation environments or "microworlds", where principles could be approached and explored in a direct way, as opposed to classical formal education using pre-determined abstractions.
Turtle graphics are a kind of vector-based graphics system, in contrast to a traditional systems raster-based system like a bitmap.
http://www.greenteapress.com/thinkpython/swampy/
see Vector graphics
Prototyping Assignment
Due date: Tuesday 14 June 2011
Create a drawing using set of cascading functions, as in the examples "arc, leaf, flower" or "building, city, starcity" worked through in class, and the exercises of Chapter 4 of Think Python.
Use the "Seymour" Inkscape extension to create a single SVG file containing your code + the resulting graphics arranged on the page.
Download and try Image:City.svg in Inscake for an example (this file doesn't display properly in the browser, but that's ok, open it in Inkscape and Run the Seymour extension. Right click and use "Save As..." to save the SVG file on your computer.)
Seymour (Inkscape Turtle Graphics Extension)
for i in range(45):
  pd()
  fd(100+i*10)
  lt(45)
  styles['stroke-width'] = i
  pu()

