User:Thijshijsijsjss/Pen Plotting Panache/Plotillism: Difference between revisions
(Create page for plotillism with an example) |
(Add note on HPGL trimming) |
||
| (10 intermediate revisions by the same user not shown) | |||
| Line 1: | Line 1: | ||
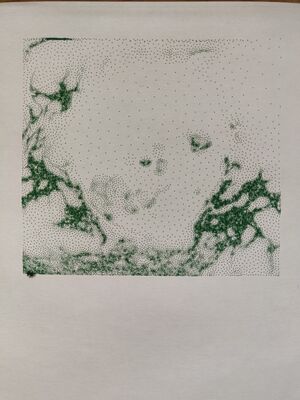
[https://en.wikipedia.org/wiki/Stippling Stippling] is a drawing technique by which details are captured by placing points in varying densities and is frequently used in the impressionistic [https://en.wikipedia.org/wiki/Pointillism pointillism]. This page describes a workflow to convert a digital image to a pointillism version that can be pen plotted. | |||
* Find the code on [https://github.com/Nyxaeroz/Plotillism GitHub] | |||
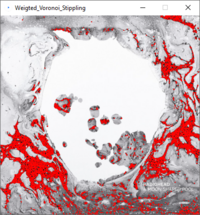
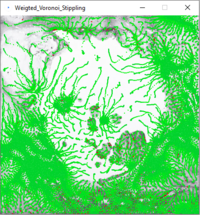
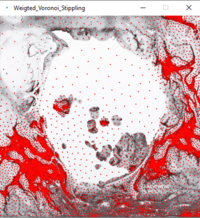
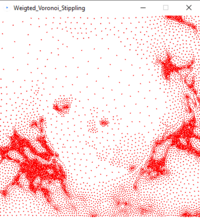
<center>Steps of Weighted Voronoi Stippling visualized (please, enjoy the typo)</center> | |||
{|align=center | {|align=center | ||
|[[File:WVS moonpool 1.png|thumb|Stochastically chosen seed points| | |[[File:WVS moonpool 1.png|thumb|Stochastically chosen seed points|200px]] | ||
|[[File:WVS moonpool 2.png|thumb|Paths of seed points during iterative relaxation| | |[[File:WVS moonpool 2.png|thumb|Paths of seed points during iterative relaxation|200px]] | ||
|[[File:WVS moonpool 3.png|thumb|Relaxed seed points after 50 iterations| | |[[File:WVS moonpool 3.png|thumb|Relaxed seed points after 50 iterations|200px]] | ||
|[[File:WVS moonpool 4.png|thumb|Relaxed seed points, no background|200px]] | |||
|} | |} | ||
[[File:WVS moonpool animation.gif|thumb|Relaxation visualized]] | |||
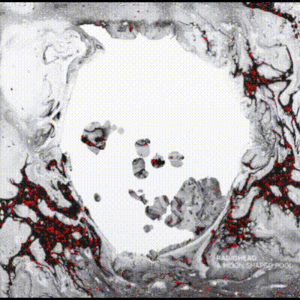
[[File:Moonpool plotillism 20240511.jpg|thumb|right|Pen plotted pointillism plot of Radiohead's A Moon Shaped Pool (mirrored, 400x400px, 20000 points, 50 iterations, 150 threshold)]] | |||
=Technique= | |||
This plotillism software is based on [https://www.cs.ubc.ca/labs/imager/tr/2002/secord2002b/secord.2002b.pdf the 2002 paper by Secord]. This paper suggests the following strategy: | |||
# Randomly place N seed points on your canvas. There are many ways to do this. | |||
# Create the [https://en.wikipedia.org/wiki/Delaunay_triangulation Delaunay diagram] for these seed points: the unique triangulation such that the no triangles circumcircle contains any points) | |||
# Create the [https://en.wikipedia.org/wiki/Voronoi_diagram Voronoi diagram] for these seed points: polygons that represent the areas that contain all coordinates that share the seed point they're closest to. This is the [https://en.wikipedia.org/wiki/Dual_graph dual graph] of the Delaunay diagram (i.e. the vertices in the Voronoi diagram are the centers of the Delaunay circumcircles). | |||
# Apply [https://en.wikipedia.org/wiki/Lloyd%27s_algorithm Lloyd's Algorithm (Voronoi iteration)] by iteratively moving the seed points to the centers of the Voronoi polygons*. This can be approximated by the average of the polygon vertices, or better yet be calculated ([https://paulbourke.net/geometry/polygonmesh/ see Paul Burke's reference]). | |||
# Use these relaxed points for 'pointillism' | |||
'''*Note''': for our purposes, we don't simply want to relax all points. This would ultimately lead to a uniform distribution. Instead, we want to base the relaxation on the brightness values of the image we feed in. The software uses this approach: | |||
# Randomly place N seed points on your canvas stochastically: choose a random location <code>x,y</code>, produce a random number <code>R</code> between 0 and <code>thresh</code>, and place a point there if and only if <code>R > brightness(x,y)</code>. This stochastic approach produces quite 'good' initial positions, i.e. the points are relatively close to their brightness-weighted equilibrium position (first image). '''O(N) complexity'''. | |||
# Create 'reversed' Voronoi diagrams by looping over all pixels, and assign the closest seed point to it. Note that we have skipped the Delaunay triangulation. Working with polygons is difficult. '''O(W*H*N) complexity'''. | |||
# Relax the seedpoints based on brightness: for every seedpoint, fetch the pixels assigned to it and calculate their weighted centroid as the new seedpoint position. '''O(N*W*H) complexity'''. | |||
# After relaxation, the seedpoints are sorted. This is done with Processing's built-in sorting function that uses quick-sort '''O(N log N)''' [https://en.wikipedia.org/wiki/Quicksort (on average)]. | |||
# Finally, the array is read and written to a file in proper HPGL syntax. | |||
==Optimizations== | |||
The software is currently quite slow. While complexity is 'linear' in theory, it is exponential in practise: if W increases, H will typically increase also (or vice versa). And with a larger canvas, you need more points to fill in all details, so N will naturally increase, too. So far, I've found <code>N = W * H / 10</code> to produce satisfactory results. This shows the exponential nature: '''O(N*W*H) = O(N * N * 10) = O(N^2)''' | |||
The current approach is victim to some naïveté, and there are some optimizations to be made: | |||
* Looping over all pixels every iteration is expensive, but there's no way around that. However, we can make a more informed quess about the seedpoint a pixel gets assigned to: if pixel P gets assigned seedpoint S (i.e. this seedpoints is the closest), it is very likely that any neighbouring pixel of P also gets assigned seedpoint S. This could (almost) remove a factor N, approximating a '''linear''' complexity (under ideal circumstances). Optimized libraries like [https://github.com/d3/d3-delaunay this one for D3] provide search functionality like this. | |||
* The instruction for each pixel is the same, hinting at some [https://en.wikipedia.org/wiki/Single_instruction,_multiple_data SIMD] magic. Indeed, in [https://www.mattkeeter.com/projects/swingline/ this blog post] Matt Keeter shows that by exploiting the graphics card's paralellist capabilities, we can calculate the Voronoi centroids in '''O(W+H)'''. | |||
=Usage= | |||
(section on how to use this software, from image choosing to plotting) | |||
==HPGL trimming== | |||
At the moment, the software will output <code>NaN</code> values that crash the plotter. Luckily, these are placed at the end of the file by the sorting algorithm, but it is still nice to clean them. This can be done in your text editor of choice, or using the command line: | |||
$ cat MY_FILE.hpgl | grep "PANaN" | wc - l | |||
> L | |||
$ tac MYFILE.hpgl | sed "1,Ld" | tac > MYFILE.hpgl | |||
(with <code>L</code> the number of NaNs at the end of the file) | |||
=References= | |||
* [https://www.cs.ubc.ca/labs/imager/tr/2002/secord2002b/secord.2002b.pdf Paper introducing Weighted Voronoi Stippling] | |||
* [https://thecodingtrain.com/challenges/181-image-stippling Coding Train tutorial and reference code] ([https://p5js.org/ p5.js] using [https://d3js.org/ D3 library]) | |||
* [https://en.wikipedia.org/wiki/Voronoi_diagram Wikipedia: Voronoi diagram] (basis for relaxation) | |||
* [https://en.wikipedia.org/wiki/Delaunay_triangulation Wikipedia: Delaunay triangulation] ([https://en.wikipedia.org/wiki/Dual_graph dual graph] to Voronoi diagram that might be used for optimized pixel-coloring) | |||
* [https://en.wikipedia.org/wiki/Lloyd%27s_algorithm Lloyd's Algorithm (Voronoi iteration)] (way of iterative relaxation of seed points) | |||
* Calculating the center of a polygon [https://paulbourke.net/geometry/polygonmesh/ Paul Burke's reference] (not used, this script is using pixel information) | |||
Latest revision as of 11:54, 25 May 2024
Stippling is a drawing technique by which details are captured by placing points in varying densities and is frequently used in the impressionistic pointillism. This page describes a workflow to convert a digital image to a pointillism version that can be pen plotted.
- Find the code on GitHub
Technique
This plotillism software is based on the 2002 paper by Secord. This paper suggests the following strategy:
- Randomly place N seed points on your canvas. There are many ways to do this.
- Create the Delaunay diagram for these seed points: the unique triangulation such that the no triangles circumcircle contains any points)
- Create the Voronoi diagram for these seed points: polygons that represent the areas that contain all coordinates that share the seed point they're closest to. This is the dual graph of the Delaunay diagram (i.e. the vertices in the Voronoi diagram are the centers of the Delaunay circumcircles).
- Apply Lloyd's Algorithm (Voronoi iteration) by iteratively moving the seed points to the centers of the Voronoi polygons*. This can be approximated by the average of the polygon vertices, or better yet be calculated (see Paul Burke's reference).
- Use these relaxed points for 'pointillism'
*Note: for our purposes, we don't simply want to relax all points. This would ultimately lead to a uniform distribution. Instead, we want to base the relaxation on the brightness values of the image we feed in. The software uses this approach:
- Randomly place N seed points on your canvas stochastically: choose a random location
x,y, produce a random numberRbetween 0 andthresh, and place a point there if and only ifR > brightness(x,y). This stochastic approach produces quite 'good' initial positions, i.e. the points are relatively close to their brightness-weighted equilibrium position (first image). O(N) complexity. - Create 'reversed' Voronoi diagrams by looping over all pixels, and assign the closest seed point to it. Note that we have skipped the Delaunay triangulation. Working with polygons is difficult. O(W*H*N) complexity.
- Relax the seedpoints based on brightness: for every seedpoint, fetch the pixels assigned to it and calculate their weighted centroid as the new seedpoint position. O(N*W*H) complexity.
- After relaxation, the seedpoints are sorted. This is done with Processing's built-in sorting function that uses quick-sort O(N log N) (on average).
- Finally, the array is read and written to a file in proper HPGL syntax.
Optimizations
The software is currently quite slow. While complexity is 'linear' in theory, it is exponential in practise: if W increases, H will typically increase also (or vice versa). And with a larger canvas, you need more points to fill in all details, so N will naturally increase, too. So far, I've found N = W * H / 10 to produce satisfactory results. This shows the exponential nature: O(N*W*H) = O(N * N * 10) = O(N^2)
The current approach is victim to some naïveté, and there are some optimizations to be made:
- Looping over all pixels every iteration is expensive, but there's no way around that. However, we can make a more informed quess about the seedpoint a pixel gets assigned to: if pixel P gets assigned seedpoint S (i.e. this seedpoints is the closest), it is very likely that any neighbouring pixel of P also gets assigned seedpoint S. This could (almost) remove a factor N, approximating a linear complexity (under ideal circumstances). Optimized libraries like this one for D3 provide search functionality like this.
- The instruction for each pixel is the same, hinting at some SIMD magic. Indeed, in this blog post Matt Keeter shows that by exploiting the graphics card's paralellist capabilities, we can calculate the Voronoi centroids in O(W+H).
Usage
(section on how to use this software, from image choosing to plotting)
HPGL trimming
At the moment, the software will output NaN values that crash the plotter. Luckily, these are placed at the end of the file by the sorting algorithm, but it is still nice to clean them. This can be done in your text editor of choice, or using the command line:
$ cat MY_FILE.hpgl | grep "PANaN" | wc - l
> L
$ tac MYFILE.hpgl | sed "1,Ld" | tac > MYFILE.hpgl
(with L the number of NaNs at the end of the file)
References
- Paper introducing Weighted Voronoi Stippling
- Coding Train tutorial and reference code (p5.js using D3 library)
- Wikipedia: Voronoi diagram (basis for relaxation)
- Wikipedia: Delaunay triangulation (dual graph to Voronoi diagram that might be used for optimized pixel-coloring)
- Lloyd's Algorithm (Voronoi iteration) (way of iterative relaxation of seed points)
- Calculating the center of a polygon Paul Burke's reference (not used, this script is using pixel information)

